3.2 Tools and workflows
An introduction to R and RStudio
Now with a view to how data can be found and accessed (3.1), we explore the different tools available for working with geospatial data and introduce R programming and the R Studio IDE.
3.2.1 Tools for working with spatial data
Just as there are many providers of spatial data, there are many different tools for working with it. The suitability of a tool depends on what we want to do, and how much time and effort willing and able to invest in learning it.
Broadly speaking, there are three main categories of tools:
QGIS, ArcGIS, GrassGIS - view, edit, and analyse spatial data through a graphical interface. Well suited to quick visual work and cartography.

R, Python, Javascript, Julia - coding tools offering more flexibility, automation, and reproducibility than point-and-click software, at the cost of a steeper initial learning curve.
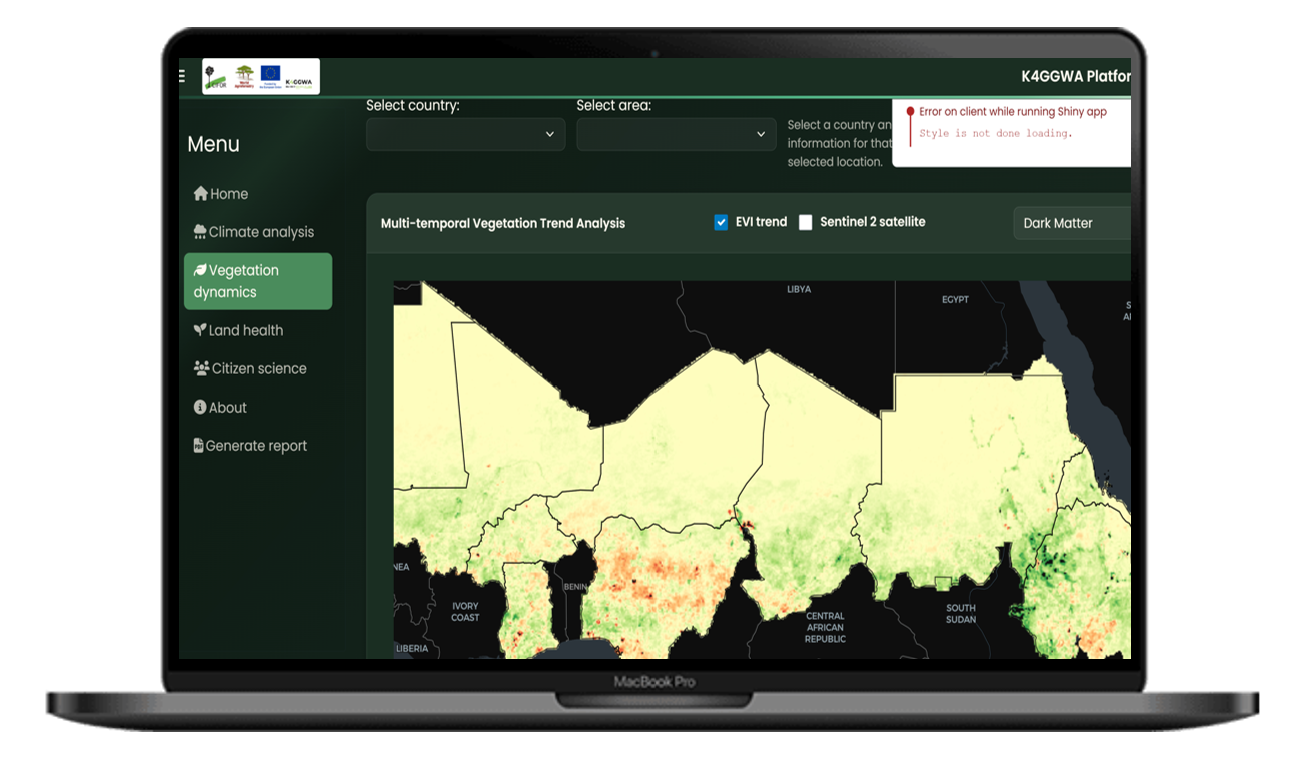
Dashboards, web apps - visualise or process data in the browser, without installing anything locally.
Working with and generating spatial evidence, responsibly, diligently 2.2.2 - reproducibly, transparently, and across a large geographic extent - is much easier with a programming approach than with point-and-click software.
For this reason, in this hub we focus on programming as the main tool for working with spatial data and particularly R - to access and work with GGW datasets in the most flexible, reproducible and transparent way possible.
3.2.2 R and RStudio

R is a free, open-source programming language originally built for statistics, and has since grown one of the most powerful tools for working with spatial data.
- Reproducibility. R scripts are complete, shareable records of every step taken to go from raw data to result, as described by the standard set out in 2.2.2.
- Powerful spatial packages. Packages like
{sf}(for vector data) and{terra}(for raster data) gives us direct, well-documented tools for working with exactly the two data structures introduced in 2.1.1. - Built for working with our data. The
{rstac}package lets us query a STAC catalog like ours directly from R, and packages like{leaflet}make it straightforward to visualise the results - the exact workflow the rest of this module leads into. - A large, active community. R has an enormous ecosystem of free packages, documentation, and community support, built up over decades of use in research and data science.
Each open-source programming language has its own advantages and disadvantages, and R is not the only option for working with spatial data. Python is another popular choice with powerful spatial data packages and capabilities and there are many other languages and tools available too. The important thing is to choose a tool that fits our needs and allows us to work effectively with the data we have.
3.2.3 Installing R and RStudio
Getting set up in two steps. If you already have R and RStudio installed, feel free to skip ahead to 3.3.
R is the language itself. Download the installer for your operating system from CRAN, and follow the default installation steps.
RStudio Desktop is a free, more user-friendly interface for writing and running R code. Install R first - RStudio needs it to work.
3.2.4 Next steps: practise in the tutorial gallery
With R and RStudio installed, we’re ready to start working with our data directly. The tutorial gallery includes a getting-started notebook that runs through loading our packages, connecting to our STAC catalog, and pulling our first dataset into R.
It’s worth reading through 3.3 first, we touch on good practice setting up a project and workflow hygiene that wil make that notebook and everything after it easier to follow.