1.2 Why spatial evidence for restoration?
Landscape restoration aims to improve ecosystem function and resilience, which support ecosystem services such as soil fertility, water regulation, forage production, and agricultural productivity.
Making effective restoration decisions therefore requires reliable evidence, understanding where degradation is occurring, which areas should be prioritised, what interventions are appropriate, and whether ecological conditions are improving over time.
To demonstrate that restoration is working, decision-makers need evidence that links restoration activities to ecological outcomes:
Restoration activity ➨ ecological change ➨ ecosystem function ➨ ecosystem services ➨ livelihood outcomes
Spatial evidence helps support this process by allowing ecological indicators to be analysed across landscapes and through time, helping practitioners identify priorities, track change, and assess restoration outcomes.
1.2.1 What we mean by spatial evidence
Spatial evidence in this context refers to information about ecological or social conditions that is linked to specific locations in the landscape and represented in mapped or spatial form.
It is useful to distinguish between spatial data and spatial evidence.

Spatial data refers to the underlying geospatial datasets that describe environmental or socioeconomic variables. Examples include satellite imagery, climate records, soil measurements, or household survey data. These datasets contain observations about the landscape but are often not directly interpretable for decision-making without further analysis.
Examples of spatial data:
- Raw reflectance values from satellite imagery
- Soil measurement point data
- Household survey response data
Spatial evidence refers to the analysed, modeled or interpreted outputs derived from spatial data, such as maps, indicators, or spatial models that help describe landscape conditions and trends.
Examples of spatial evidence:
- Hotspot erosion prevalence map
- Soil organic carbon predictive map
- Rainfall patterns and drought trend map
- Species diversity charts
Put simply, spatial data is the raw information about the landscape, while spatial evidence is the processed information that helps us understand what is happening on the ground and supports decision-making: Spatial data ➨ analysis or transformation ➨ spatial evidence
1.2.2 Advantages of spatial evidence for restoration
Spatial evidence offers several advantages for restoration planning and monitoring.
Landscape coverage, scalability and temporal analysis
Spatial evidence can provide information across entire landscapes rather than only at sampled locations, showing patterns across districts, watersheds, or countries, supporting decisions at multiple levels. They can also be tracked over time to detect trends and changes.
Comparability and transparency
Spatial evidence enables the same indicators to be used across projects or regions, whereby results become easier to compare and aggregate.
This helps build a shared understanding of landscape conditions and restoration outcomes across different contexts, improving transparency and accountability.
Integration with other information
Spatial evidence supports combining and comparing many different variables together, such as restoration site locations, climate data, vegetation data, or socioeconomic data.
This helps reveal how ecological conditions interact with other factors that influence restoration progress, restoration impact pathways, and integrated decision-making.
Science-based, consistent, high-resolution information across large areas, supports more informed decisions throughout the restoration decision-cycle.
From targeting priority areas and designing interventions to monitoring results, spatial evidence helps programmes allocate resources more efficiently and maximise the return on restoration investments.
1.2.3 Spatial evidence in practice
Spatial evidence is increasingly available through a wide range of open datasets, digital platforms, and online mapping tools produced by research institutions, governments, and international organisations.
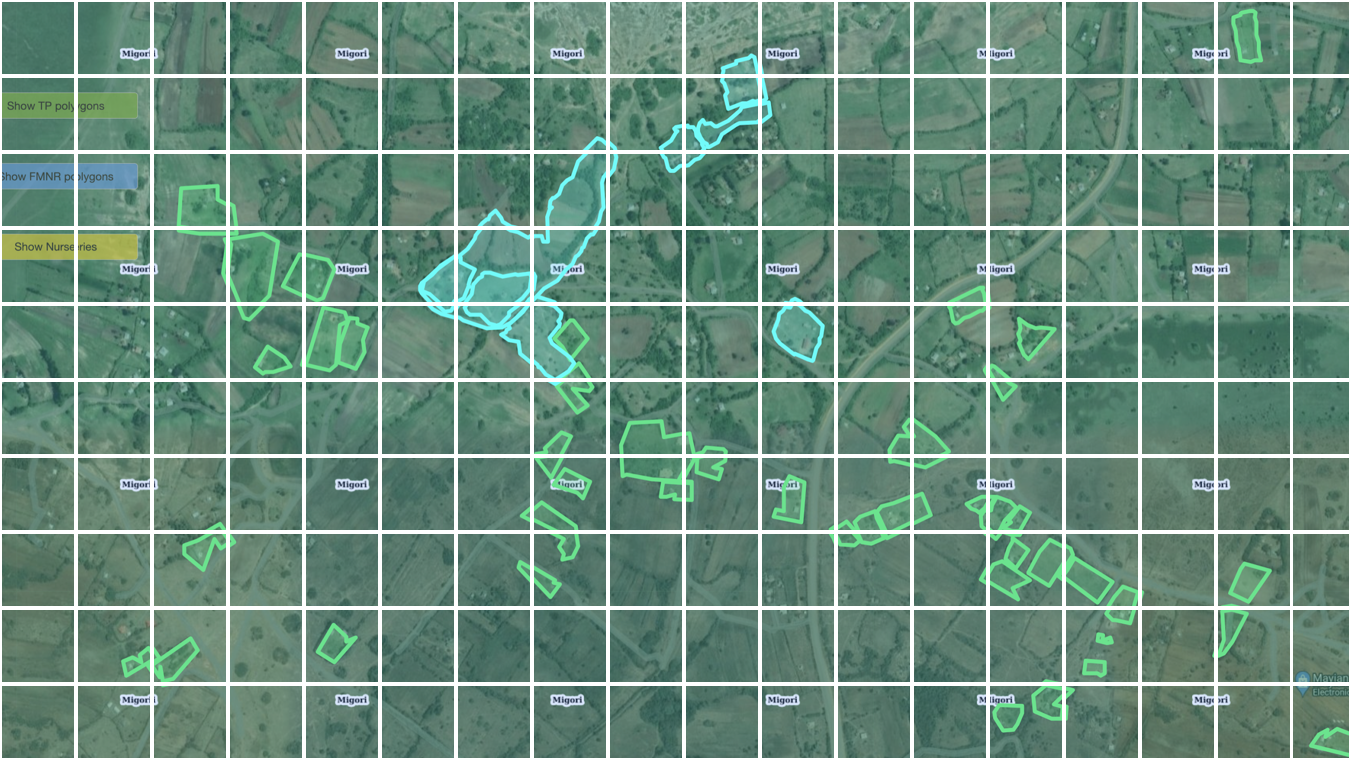
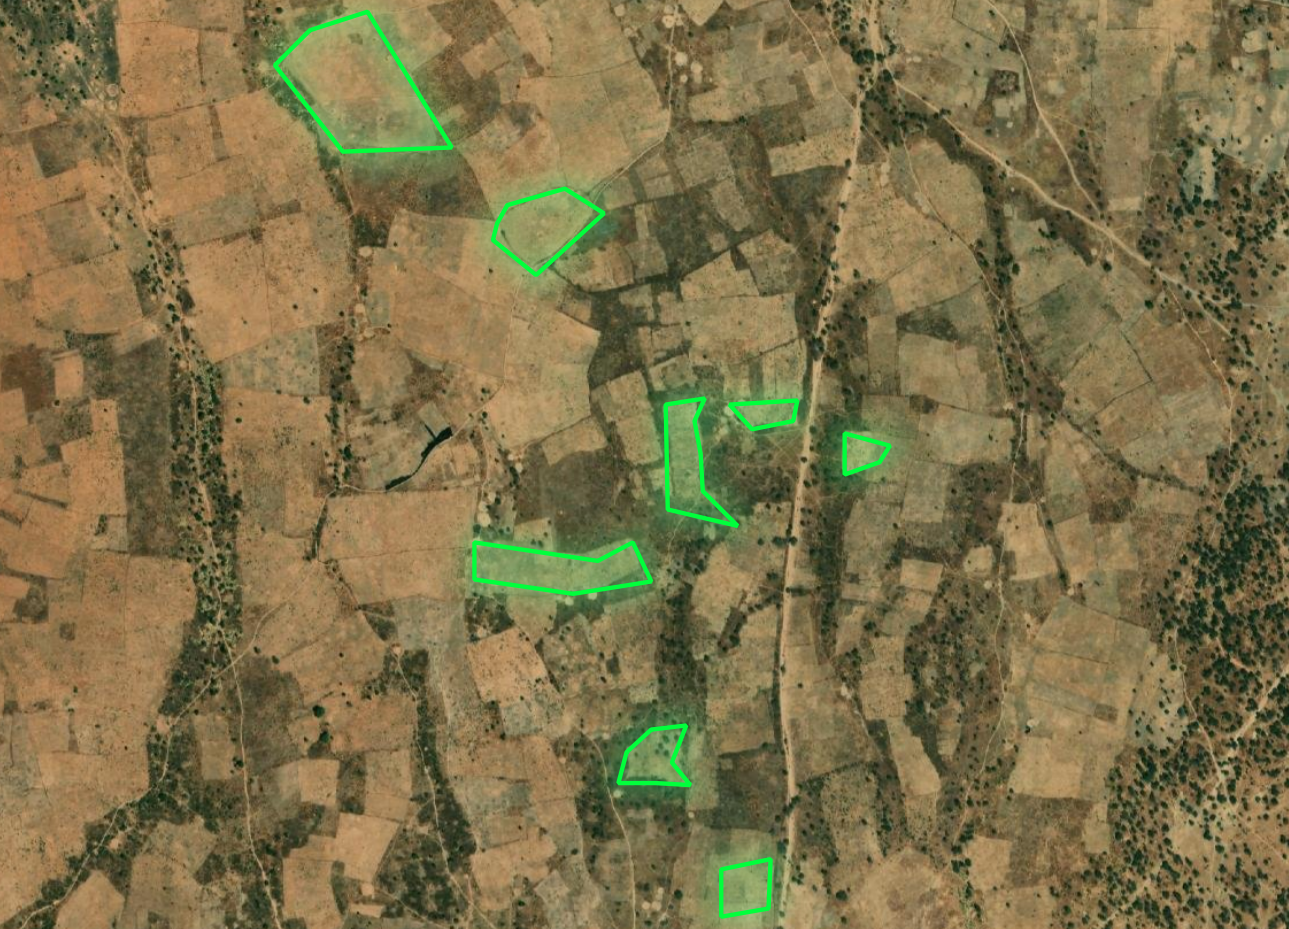
Some of these tools are designed for visual exploration and communication, such as interactive dashboards and web maps that allow users to quickly understand landscape patterns and trends.
Others provide access to the underlying spatial datasets used to generate maps, enabling more detailed analysis by technical users such as monitoring specialists, analysts, or researchers.
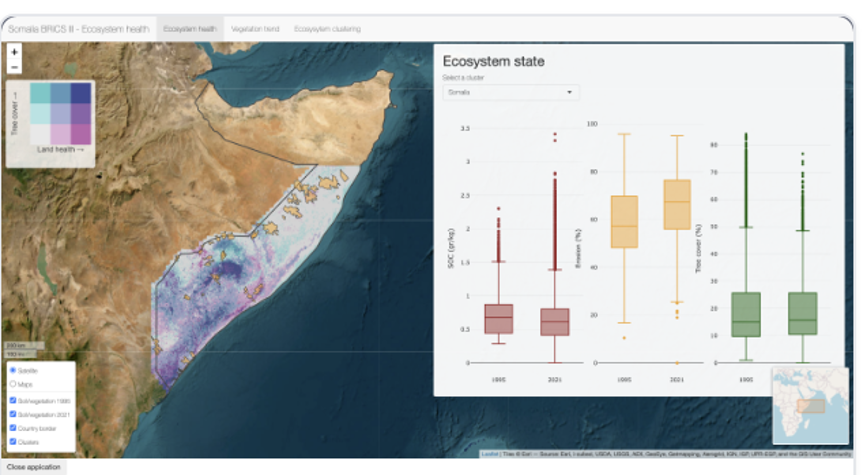
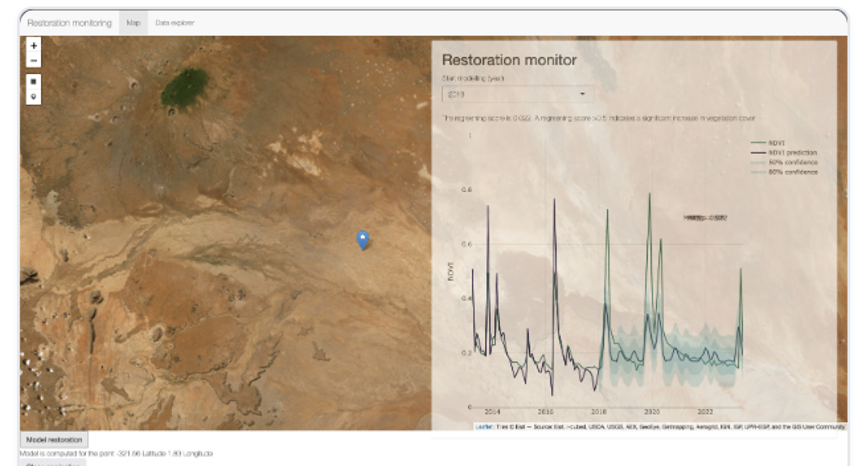
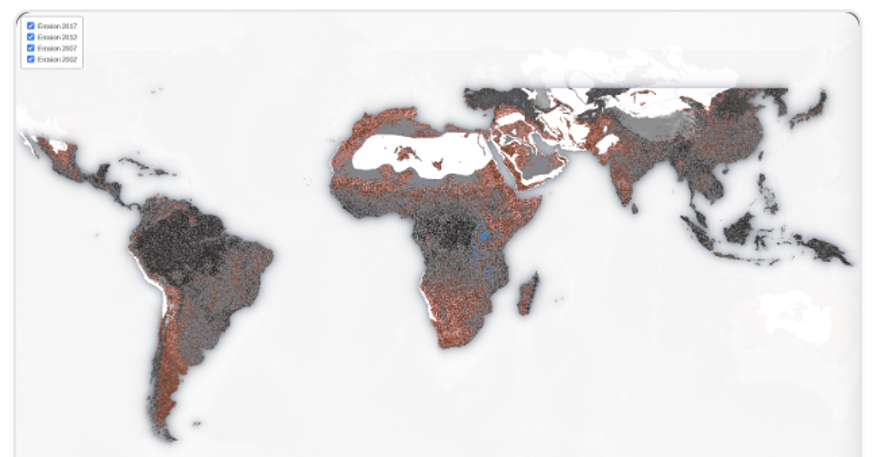
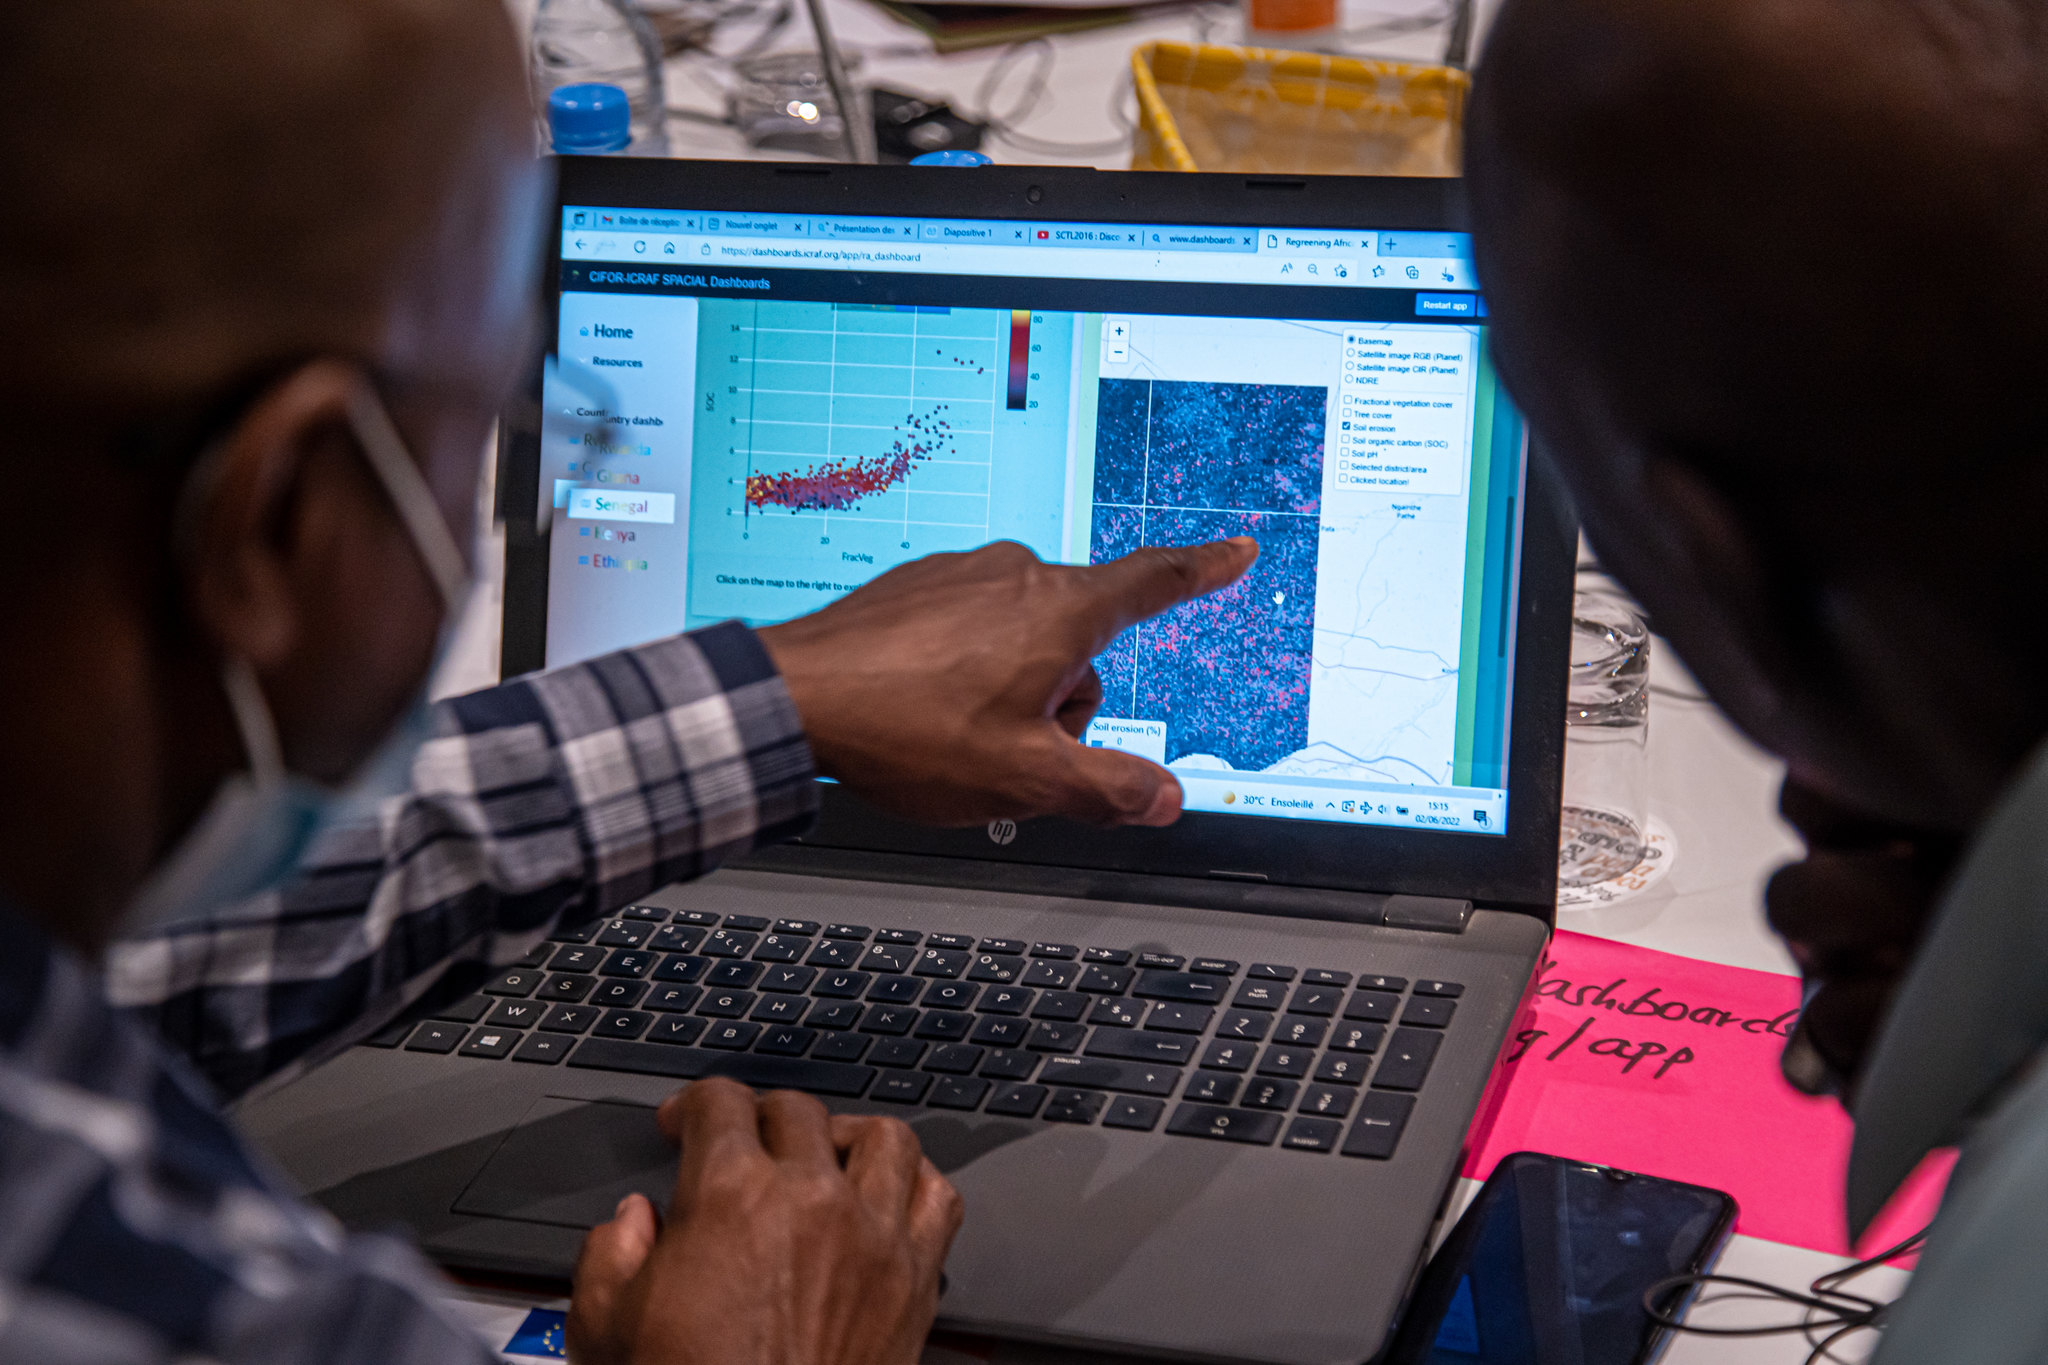
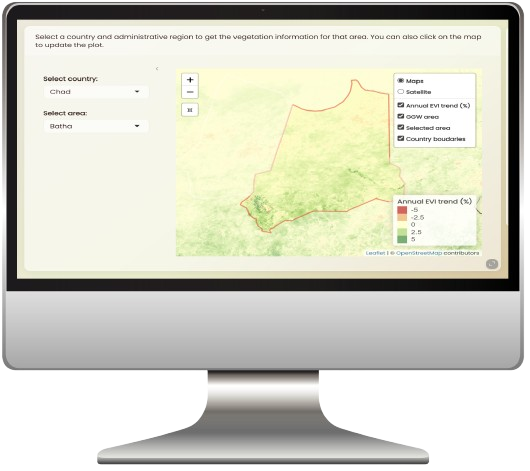
Figure 2. Land health dashboards are one example of a powerful tool for visualising where conditions are degrading or improving and how trends are changing over time, supporting decisions about where to restore, what actions to take, and how to monitor progress.
Because spatial evidence can come from many different providers and analytical approaches, it is important to interpret maps carefully.
Indicators should ideally be based on reliable data sources, scientifically robust methods, and clear documentation of how they were produced, and they should be appropriate for the scale and decision context in which they are used.
For this reason, building confidence and capability in understanding the data behind maps and other spatial evidence products (how data was collected, processed, and analysed), supports more precise, transparent, and defensible restoration decisions.
The next section explores why working directly with spatial evidence and the underlying data can strengthen restoration planning, prioritisation, monitoring and reporting.
Learn more
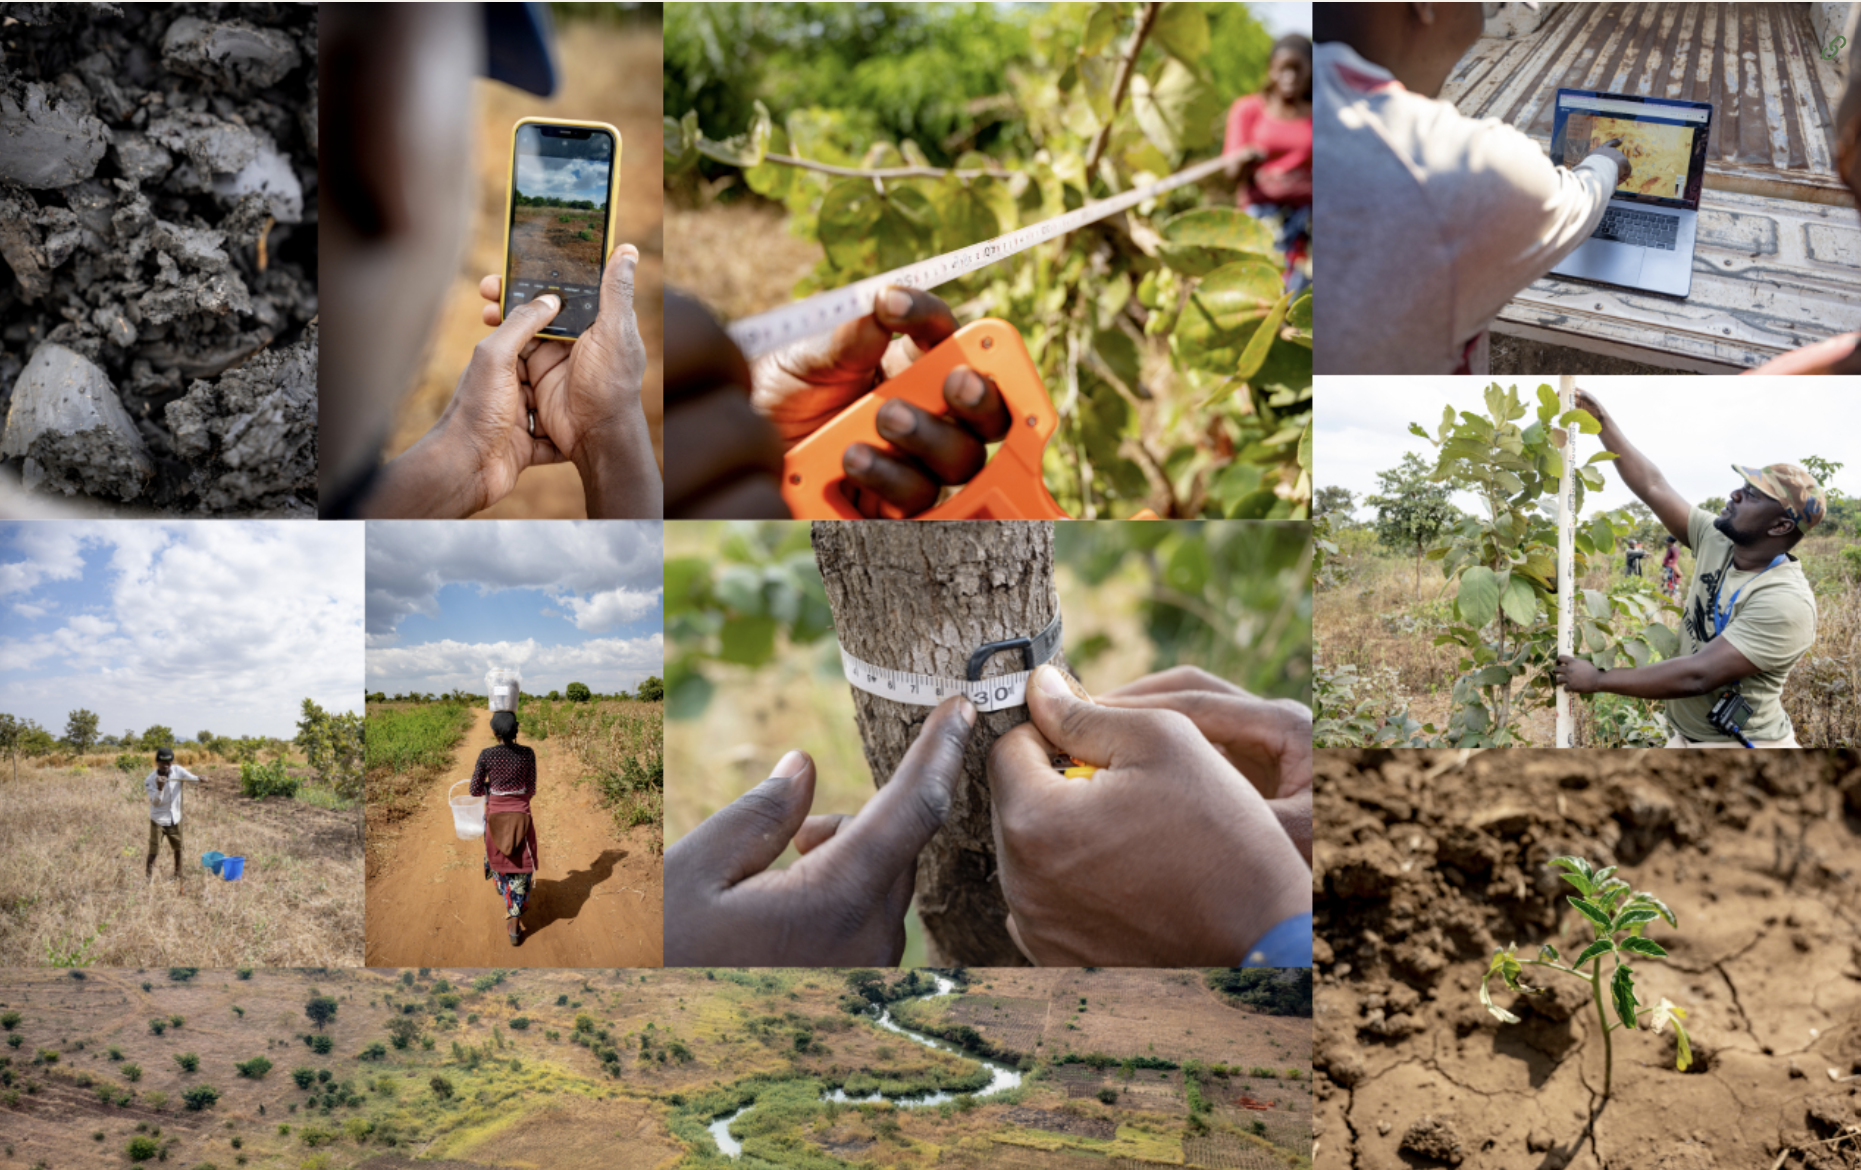
Learn about the Land Degradation Surveillance Framework (LDSF), the world's most widely deployed systematic, standardised approach to collecting and analysing spatial data for restoration monitoring and reporting.
Explore land health dashboards for the Great Green Wall, which provide visual summaries of spatial evidence on land health and restoration progress across the region.