Notebook 1: R Basics and Climate Data
This first notebook introduces the main working environment used throughout the workshop: programming with R in RStudio.
It begins with the basics of working with R, then applies these skills to climate datasets, helping participants move from simple coding tasks to practical data analysis workflows relevant to restoration planning.




Notebook 1 provides the foundation for all subsequent practical work. It introduces a progressive workflow using RStudio, building confidence in working with code, data, and outputs before moving on to more complex workflows focused on land health, soil health, and spatial analysis.
What you will learn and do
This notebook is organised around three connected sections:
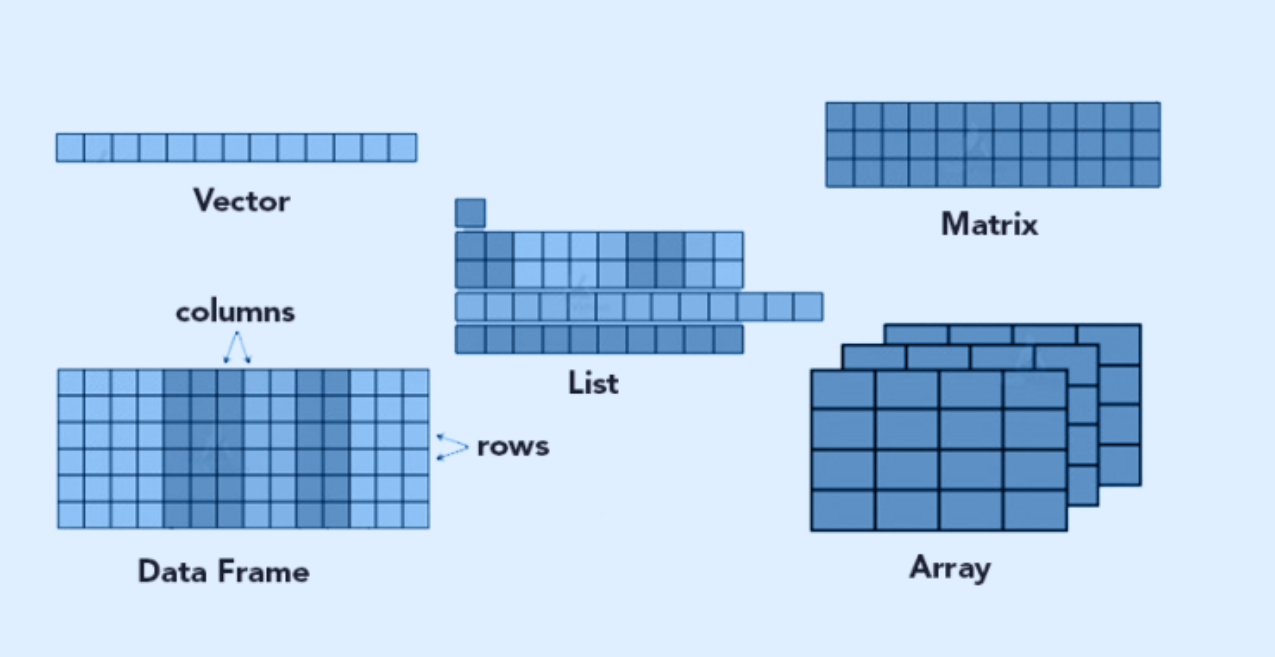
The first section introduces the basic logic of working with R in RStudio.
- What R is and why it is useful
- How to organise a workflow combining text, code, and outputs
- How to run code, create objects, and work step by step
- How libraries such as
dplyrandggplot2extend the capabilities of R
The second section introduces climate as a relevant theme for restoration and applies the same workflow to real-world data used in the workshop.
- Load precipitation and temperature data
- Examine dataset structure and variable names
- Check values, missing data, and descriptive statistics
- Use simple transformations and grouped summaries
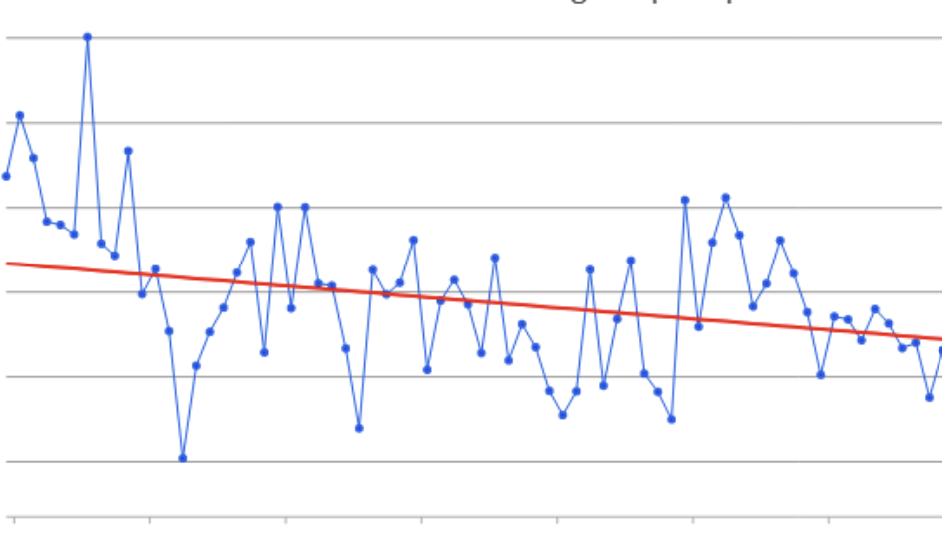
The final section uses simple charts and visual outputs to help participants begin interpreting and communicating climate information.
- Create introductory plots with
ggplot2 - Explore variation between locations and variables
- Interpret simple precipitation and temperature trends
- Save outputs within an organised folder structure
Climate data in restoration
Climate is one of the most important background conditions influencing restoration outcomes. Variables such as precipitation and temperature influence:
- Vegetation growth and seasonal productivity
- Soil moisture and water availability
- Drought stress and regeneration potential
- Erosion risks and land degradation dynamics
- The suitability of different restoration interventions across locations
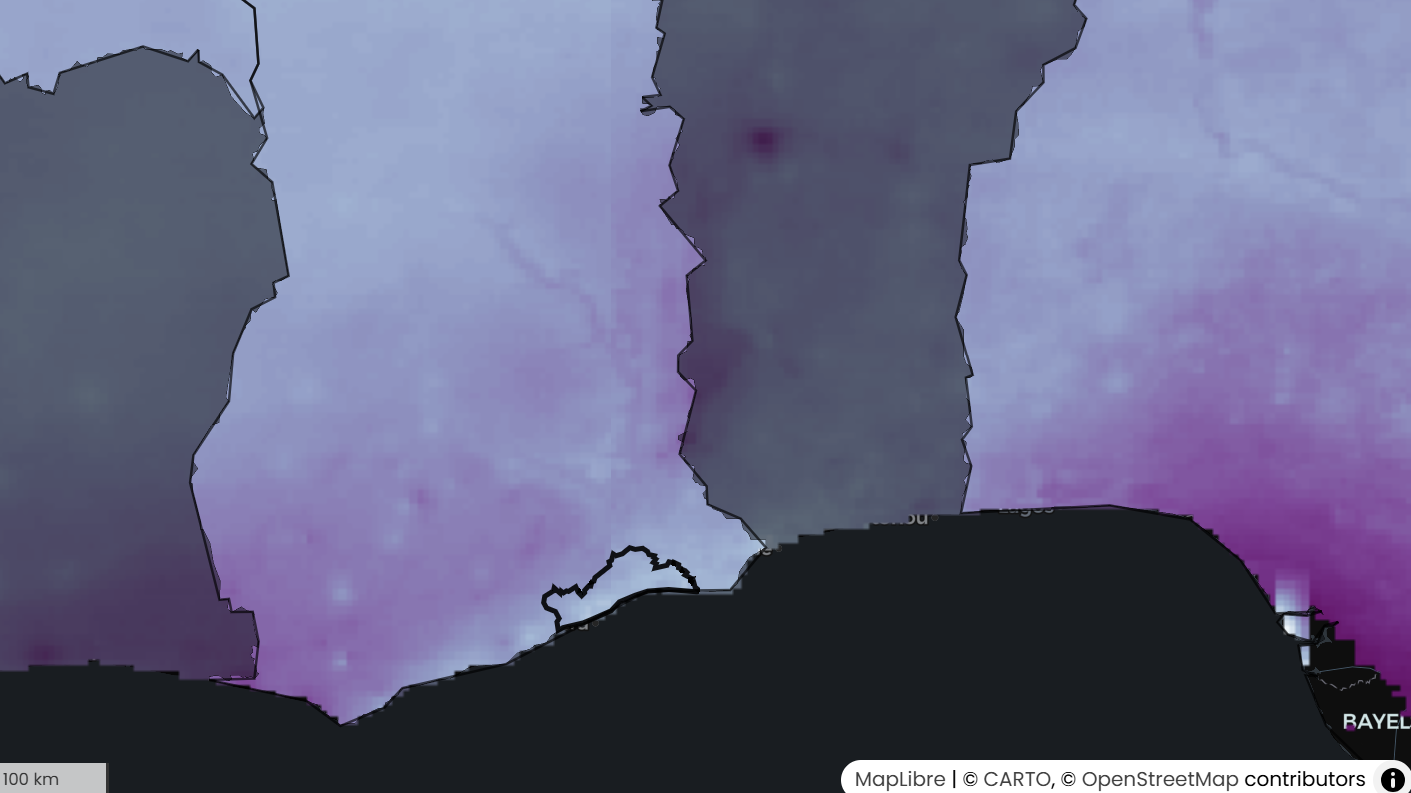
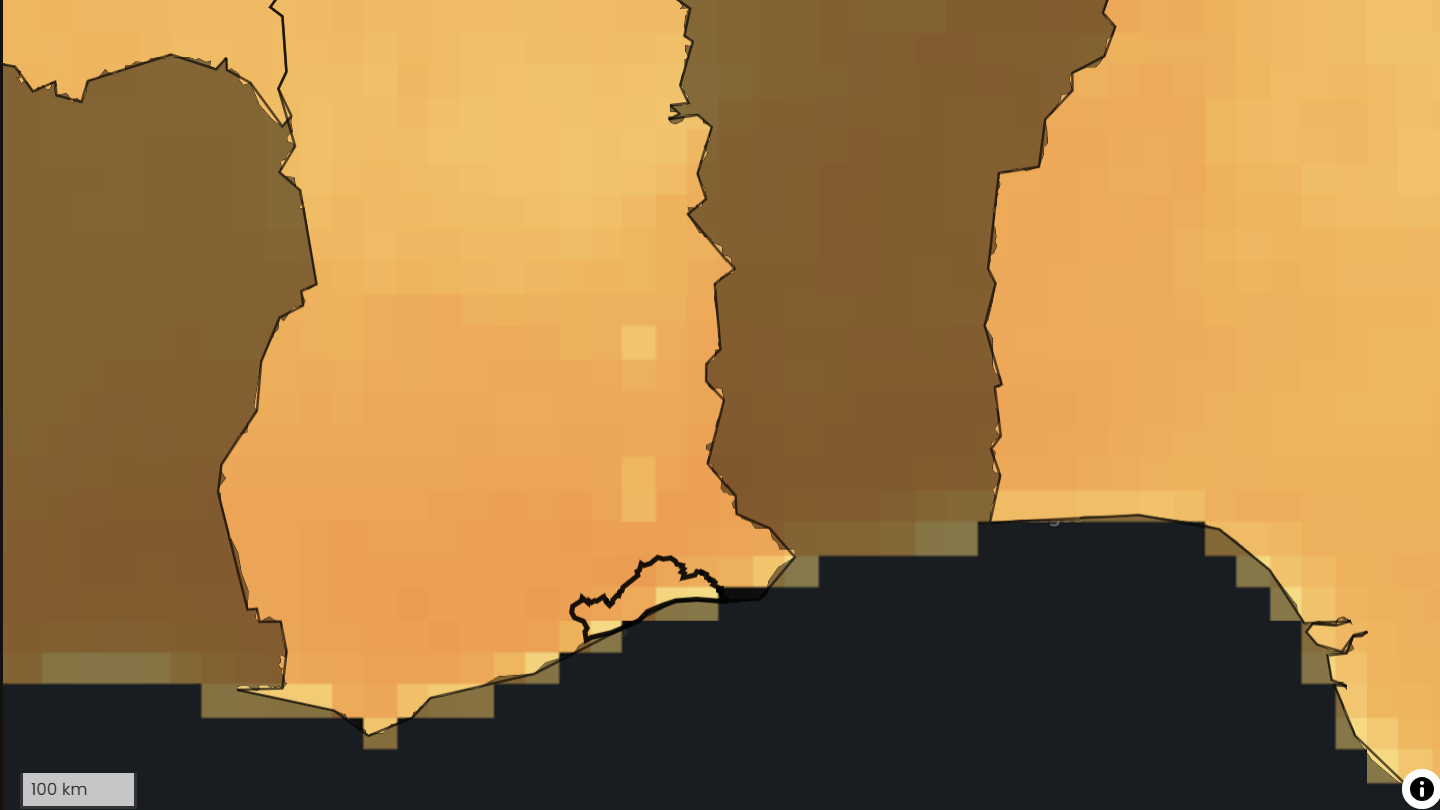
Climate interacts with other landscape processes, including vegetation cover, land use, and soil condition. This is why climate data are often used alongside land health and soil health indicators to identify priority areas, interpret trends, or design restoration strategies.
Getting started
Before you begin, read the steps below carefully.
1. Download the notebook
Click the button below to download the notebook .qmd file.
2. Open the notebook in RStudio
Open RStudio on your computer.
Then:
- Click File → Open File
- Select the
.qmdfile you just downloaded- The notebook will open in RStudio
- Make sure you are working in the correct project folder
3. Follow the steps in the notebook
The notebook is structured as a guided workflow. Simply follow the instructions step by step to begin working with climate and restoration data.