1.3 Understanding and working with spatial evidence
In the previous sections we explored why spatial evidence is increasingly important for restoration decision-making.
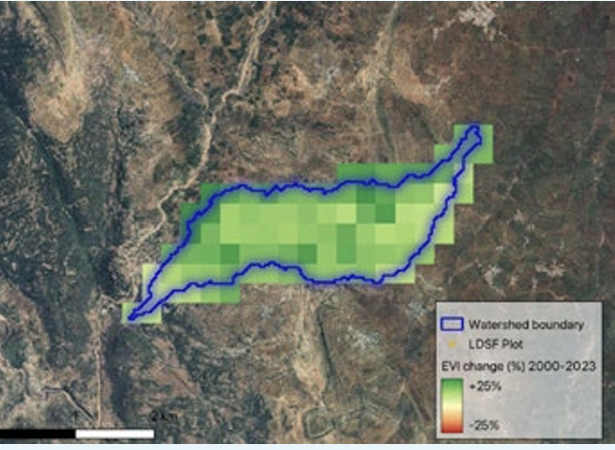
Spatial indicators and maps reveal trends and patterns across landscapes, helping practitioners understand where degradation is occurring, where and what kinds of restoration interventions may be needed, and how ecological conditions are changing over time.
However, spatial evidence comes from a variety of sources, produced using different data inputs, analytical methods, validation processes, transparencies and certainties.
It is therefore important for practitioners to understand what they are working with when interpreting maps and spatial indicators.
Developing a basic understanding of how spatial evidence is generated and interpreted helps ensure that maps and indicators are used appropriately when planning restoration interventions.
1.3.1 Not all spatial evidence is the same
Spatial evidence products are produced by many different organisations, including research institutions, governments, international development agencies, and regional environmental bodies.
Although these products may appear similar, they are not all generated in the same way. Different tools may use different datasets, analytical approaches, modelling techniques, validation processes, and assumptions.

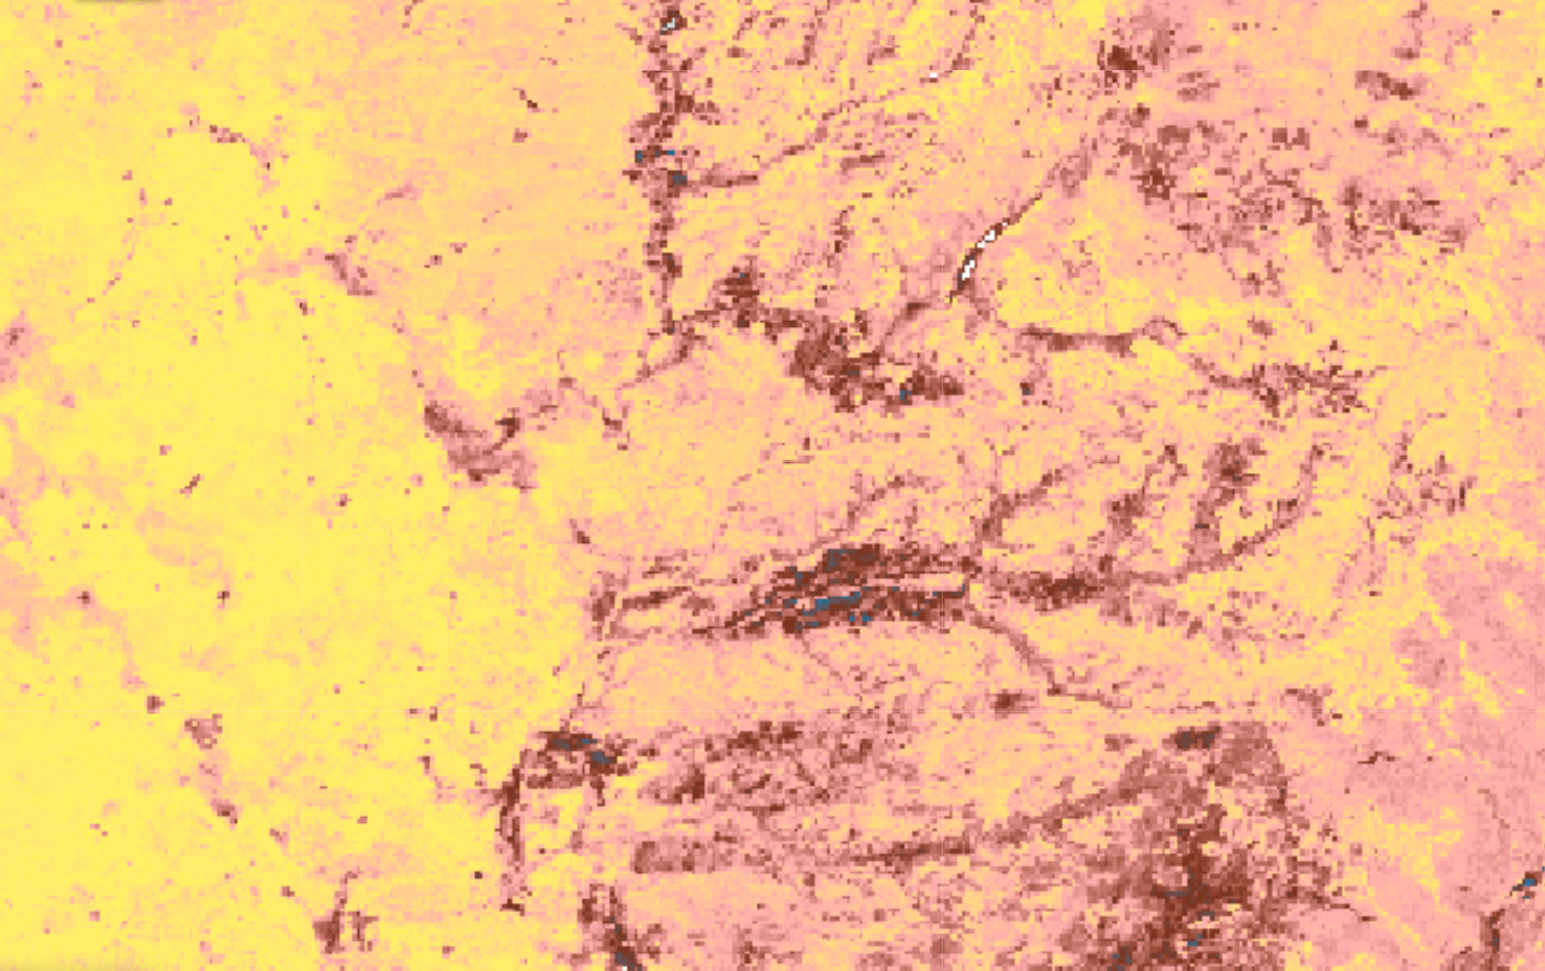
For this reason, two maps describing the same environmental phenomenon, such as soil organic carbon or erosion prevalence, may sometimes produce slightly different values.
This doesn’t necessarily mean that one map is correct and the other incorrect, but rather it reflects the fact that spatial evidence is shaped by the choices made in how data is collected, processed, analysed, and ultimately represented.
Spatial evidence should therefore always be interpreted carefully and practitioners should ask things like:
- What data sources were used to produce this? How were the underlying data collected?
- Which modelling or analytical methods were applied and are they appropriate given the data being used?
- How were the outputs validated? What kinds of validation methods were used and how transparent are the results?
- What assumptions were made when combining multiple datasets? Do these indicators make sense together?
- What spatial and temporal resolution does it represent?
These factors can all influence the results shown in a spatial product, and they affect how confidently the evidence can be interpreted and applied.
1.3.2 Understanding spatial evidence supports better restoration decisions
Spatial evidence provides powerful insights into landscape conditions, but its value depends on how well it is understood and applied.
Developing the skills and know-how to work with spatial evidence allows restoration practitioners to make more precise, confident and defensible decisions.
Understanding how spatial evidence is produced helps restoration practitioners make decisions that are more:
- Precise, because indicators can be used at the right spatial and temporal resolution for the decision context
- Transparent, because the data sources, assumptions, and methods behind the evidence are clear
- Defensible, because decisions can be justified using traceable and documented evidence
- Optimised, because multiple indicators can be combined and tailored to the decision context
- Accountable, because results can be compared, explained, and communicated more clearly to partners, funders, and stakeholders
Consider the following two examples:
Identifying restoration areas
A map may highlight regions with low soil organic carbon across a landscape. By working with the underlying spatial data, we can calculate specific metrics like:
- the average SOC level within a district
- the proportion of land below a defined threshold
- how conditions vary across watersheds or administrative areas
These insights help determine which areas should be prioritised first for restoration interventions.
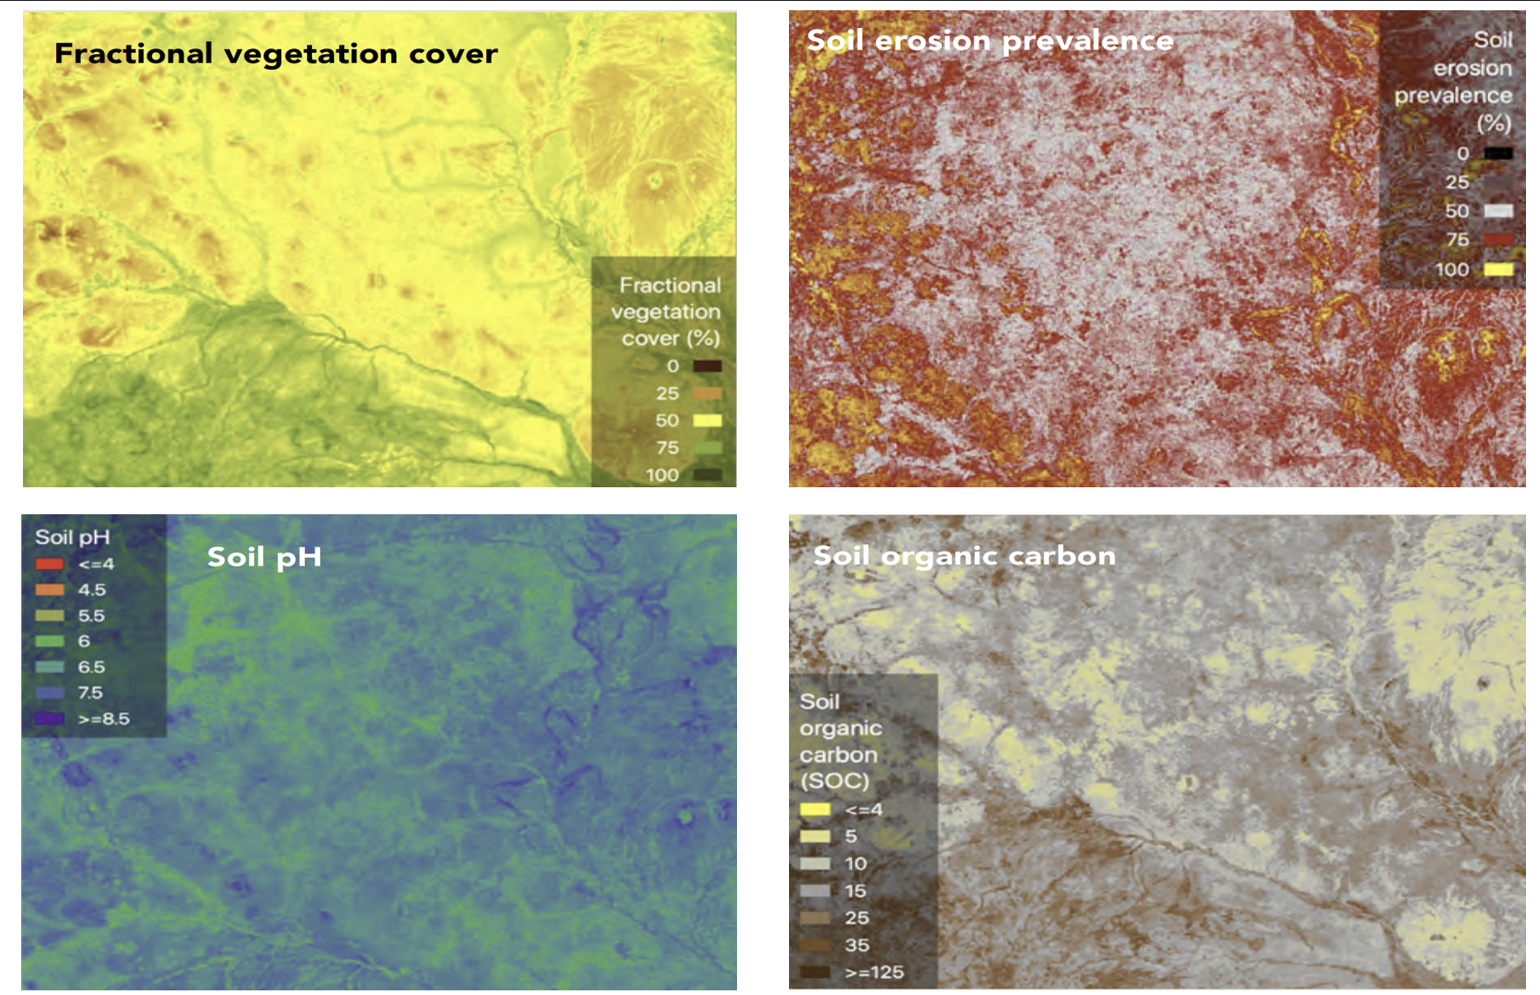
Combining multiple ecological indicators
Restoration planning often requires considering several ecological variables simultaneously. Practitioners may wish to identify areas where:
- soil erosion prevalence is high
- vegetation cover is declining
- rainfall conditions support the targeted restoration work
The combination of multiple spatial indicators together lets decision-makers undertsand the landscape and degradation trends and to better tailor intervention design to local context with defined and targeted ecological outcomes.
1.3.3 Example: using spatial evidence to support restoration prioritisation
The example below shows how this kind of reasoning can support a simple restoration prioritisation decision.
Restoration prioritisation in the landscape
Imagine a regional restoration programme with funding to support interventions in three out of six districts. The programme aims to strengthen livelihood resilience and agricultural productivity in rural communities.
To achieve these outcomes, the programme seeks to improve several ecosystem services that support local livelihoods, including soil fertility for crop production, water regulation and drought resilience, and reduced soil erosion.
These ecosystem services depend on the condition of underlying ecological functions, such as soil organic matter, vegetation cover, and diversity of vegetation functional groups.
The decision question is therefore:
Which districts should be prioritised to achieve the greatest improvement in these ecological conditions and associated livelihood benefits?
Step 1: Clarify the objective
Before analysing or even accessing data, the restoration objective must be clearly defined. In this example, the objective is to improve ecosystem services that support rural livelihoods by restoring key ecological functions.
This means prioritising areas where interventions are likely to improve soil fertility and productivity, reduce erosion and land degradation, and strengthen resilience to climate variability.
Step 2: Identify relevant indicators
Once the objective is defined, spatial indicators can be selected to represent the ecological functions that influence these ecosystem services. Examples might include soil organic carbon (SOC), erosion prevalence, rainfall variability, and vegetation condition.
Each indicator represents a different dimension of land health and ecosystem function that influences livelihood outcomes.
Step 3: Compare districts using consistent metrics
Using spatial data, these indicators can be summarised for each district in a consistent way. For example, analysts might calculate the average SOC value per district, the proportion of land with high or severe erosion, or trends in vegetation condition over time.
This step transforms visual patterns seen in maps into comparable numerical indicators so decision-makers can evaluate districts using consistent metrics that describe ecological conditions over time and across the landscape.
Step 4: Apply transparent prioritisation criteria
Once indicators have been summarised, they can be combined to support prioritisation. A simple rule might prioritise districts where SOC is below and erosion is above a defined threshold. For example, we might decide to prioritise regions below 5t C/ha and with vegetation cover less than 10%.
This supports transparent and defensible decision-making - the data used are openly available, the thresholds are documented, and analytical methods can be reproduced.
Step 5: Review uncertainty and evidence quality
While drawing on maps and before finalising decisions, it is important to consider the confidence and uncertainty associated with the evidence. Are indicator estimates equally reliable across all districts? Are some areas affected by limited data coverage? Would additional field observations improve confidence in the results?
Recognising uncertainty helps ensure that spatial evidence is interpreted carefully and that decisions remain grounded in the strength of the available data.
This simple example shows how spatial evidence can help practitioners translate livelihood and ecosystem service objectives into measurable ecological indicators, use structured comparison of landscapes, and apply clear and transparent prioritisation criteria to their decisions.
Understanding spatial evidence in this way supports all stages of the restoration decision-cycle - it can be used to compare baseline and trending ecological conditions, design appropriate interventions and track ex-post changes in vegetation condition or soil health, and generate more consistent evidence for reporting to governments and partners, and attract project finance.
In the next module we examine how spatial evidence is generated from spatial data, how different kinds of spatial evidence are produced and common formats, and how it should be interpreted when using them for restoration planning and monitoring.
Knowledge check
Q1. Which statement best describes spatial evidence?
Q2. Why is spatial evidence especially useful for restoration planning?
Q3. When using spatial evidence to prioritise restoration areas, what is one important reason to understand how a map or indicator was produced?