Practical exercises
Hands-on workflows for working with restoration data in notebooks
The Foundations modules explain the key concepts behind spatial evidence fo restoration decision-making. The practical exercises in this section show how to work with data in a notebook environment, building from basic R programming skills to more complex workflows for handling spatial datasets.


The practicals are designed to be guided, lightweight, and progressive. They are intended for workshop use, but they can also serve as reference materials that participants return to later when they want to repeat or adapt a workflow.
What you will practice
Across the practical notebooks, you will learn how to run and edit code in a notebook, import and inspect datasets, check variable structure and missing values, clean and transform tables, and create simple visualisations.
As the sequence progresses, you will also begin working with climate time series, spatial vector datasets, predictive rasters, and simple summaries that combine multiple forms of data.
After completion of these exercises you should feel comfortable accessing, handling and analysing spatial data using R in a notebook environment.
Recommended environment: Google Colab
To minimise setup challenges, the practicals run in Google Colab, a web-based notebook environment. This makes it possible to work with code, explanations, and outputs in the same place without needing to install software locally.
When opening a notebook, it is recommended to click File -> Save a copy in Drive so that you keep your own editable version. This is especially useful in a workshop setting, since Colab sessions can reset and unsaved progress may be lost.
Learn more

Learn more about Google Colab, the cloud-based notebook environment used in these practicals, including how to use it and its key features.

A learning hub for R programming, including free online courses, tutorials, and resources for beginners and experienced users alike.
Data used in the practicals
The notebooks use small example datasets designed to be quick to load and easy to interpret during a workshop. Depending on the exercise, these may include tabular land health datasets, simple climate time series, polygon boundaries, and predictive raster layers such as soil organic carbon or erosion-related indicators.
In some cases, the workflow is introduced first using a small example dataset before being adapted to more realistic restoration data.
Learn more
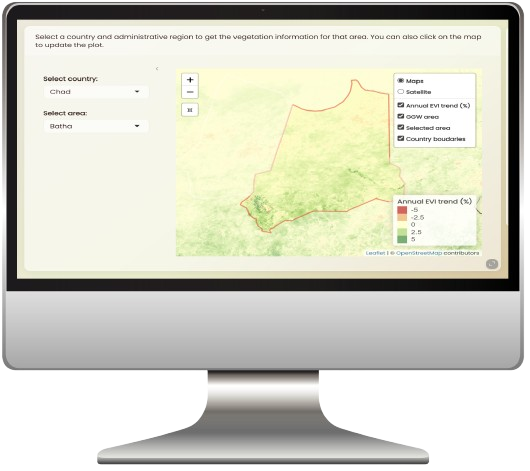
Interactive dashboards for exploring land health, climate, and restoration-relevant data across the GGW region, with downloadable datasets and visualisation tools.
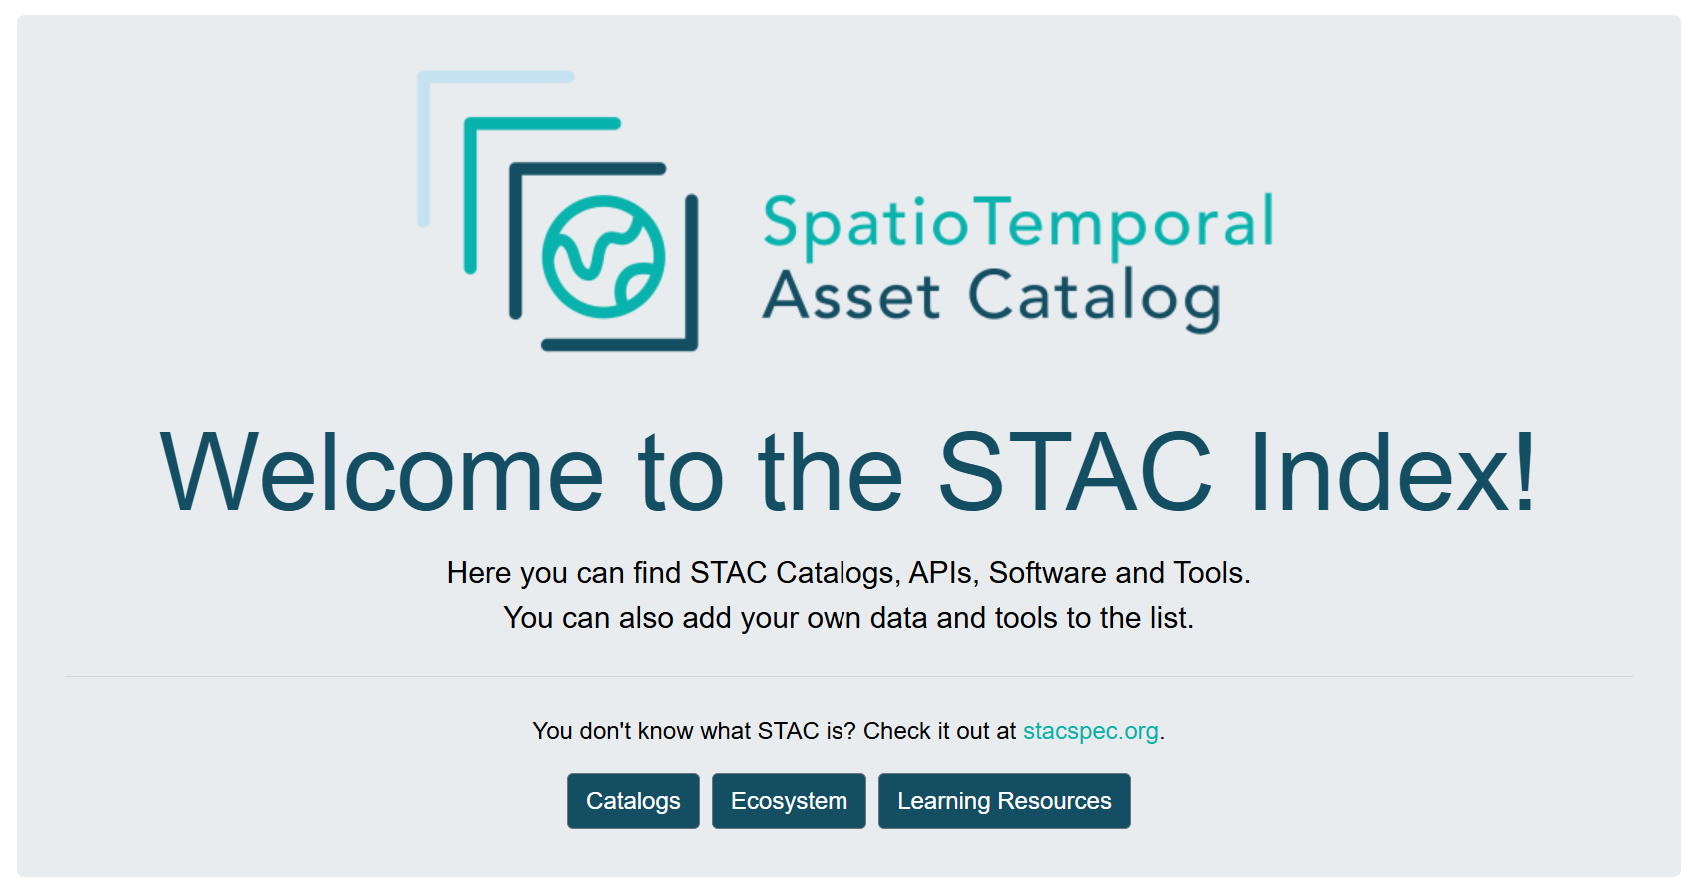
A website for browsing STAC catalogues and APIs, providing access to a wide range of datasets relevant to land health, restoration, and climate across the Sahel.
Practical notebook sequence
The notebooks are designed to be followed in sequence, with each one building on the skills introduced in the previous practical.
This first practical introduces the core environment used throughout the workshop: R programming in Google Colab.
It is designed for participants who are new to coding or new to notebook-based workflows. The aim is to build confidence with the basics: running cells, understanding the difference between text and code, creating simple objects, importing a small dataset, and carrying out basic operations using dplyr.
This practical provides the foundation for everything that follows.
This practical builds directly on the first notebook by focusing on how to work more carefully with tabular land health data.
Participants learn how to inspect dataset structure, identify missing values or inconsistent variables, clean and transform columns, and create simple visualisations using ggplot2.
It also introduces the basic logic of the grammar of graphics, helping participants understand how different plot types can be used to explore patterns in restoration-relevant datasets.
This practical introduces the idea of change over time, which is central to understanding degradation, recovery, and climate variability in restoration contexts.
Participants work with climate-related variables and simple time series data, learning how repeated observations can be organised, visualised, and interpreted.
The notebook introduces the idea of a trend, how trends are calculated in simple terms, and how time series plots can reveal changing conditions across years or seasons.
This practical introduces spatial vector data and spatial data frames using the sf package.
Participants load polygon datasets such as site boundaries or administrative units, inspect their attributes, and begin understanding how geometry and tabular information are linked in GIS workflows.
The notebook also introduces basic interactive mapping using leaflet.
This final practical introduces raster data using terra and shows how raster and polygon datasets can be used together in a simple analytical workflow.
Participants load a predictive raster layer, combine it with polygon data, and extract values by spatial unit in order to generate summaries for sites, districts, or restoration areas.
By this stage, participants will have moved from basic notebook skills to a complete introductory workflow for handling, exploring, and summarising restoration-relevant spatial data.
Troubleshooting and support
If something does not run as expected, the most common causes are package installation issues, file path problems, Colab session resets, or temporary browser and internet issues. In most cases, it helps to save a copy of the notebook early, use a stable browser such as Chrome or Edge, and rerun cells from top to bottom if the runtime has restarted.