Practical 2: Data handling and visualisation
This practical builds on the foundations introduced in Practical 1 by focusing on how to inspect, clean, structure, and visualise tabular datasets in R.


In order to work confidently with spatial indicators and dashboard exports, it is important to understand how to:
- Check the structure of a dataset
- Clean and organise variables
- Filter and transform data
- Create clear summary visualisations
This practical helps participants move from simply loading data to working with it more critically and meaningfully.
Learning objectives
After completing this practical you should be able to:
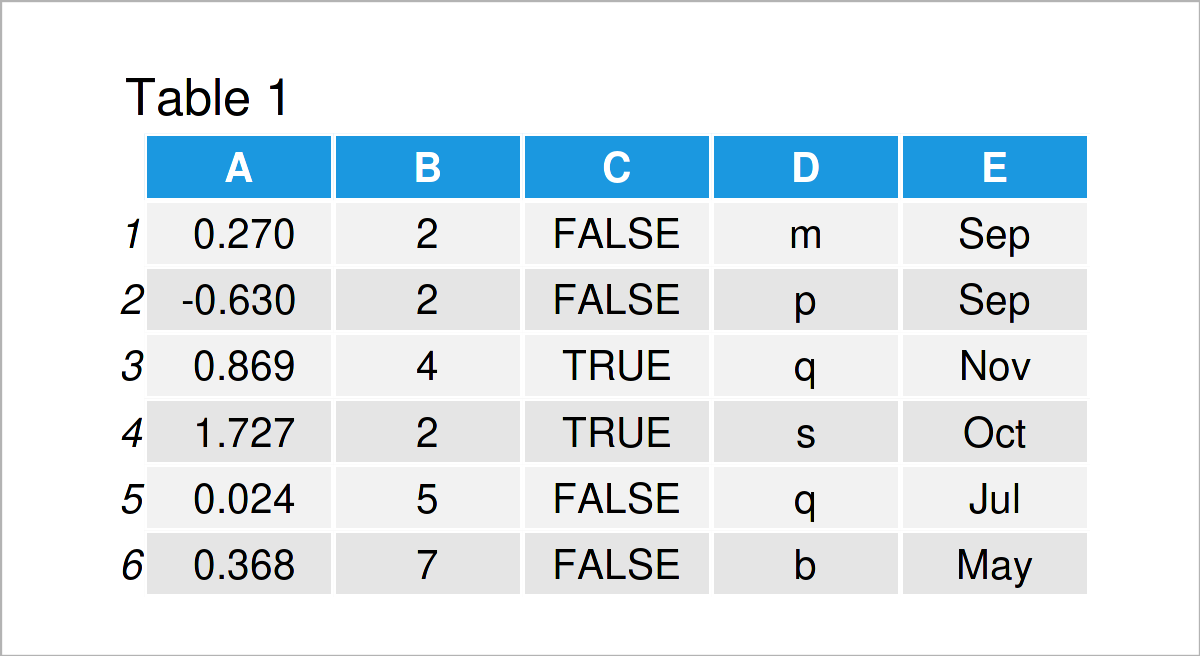
- Inspect the structure and contents of a tabular dataset
- Identify and clean common data issues
- Filter, transform, and summarise variables
- Understand the basic logic of
ggplot2- Create simple plots to explore patterns in data
This practical introduces three key ideas:
You will learn how to:
- Check dataset structure
- Inspect variables and data types
- Identify missing or inconsistent values
- Prepare data for analysis
Clean and well-structured data is essential for reliable analysis.
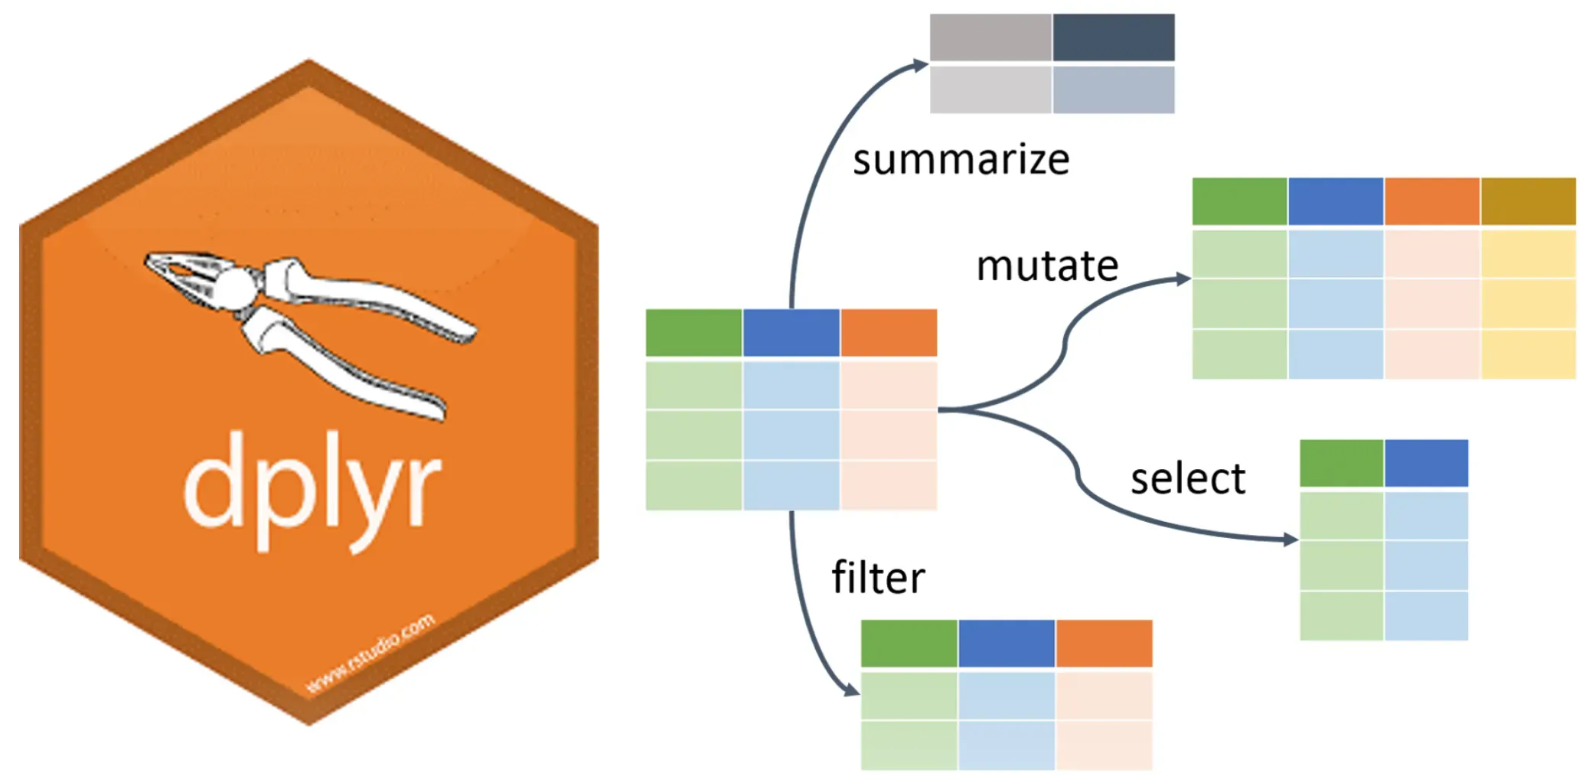
You will use tools from dplyr to:
- Filter rows
- Select and rename variables
- Create new columns
- Summarise key patterns in the data
These steps help turn raw tables into interpretable information.
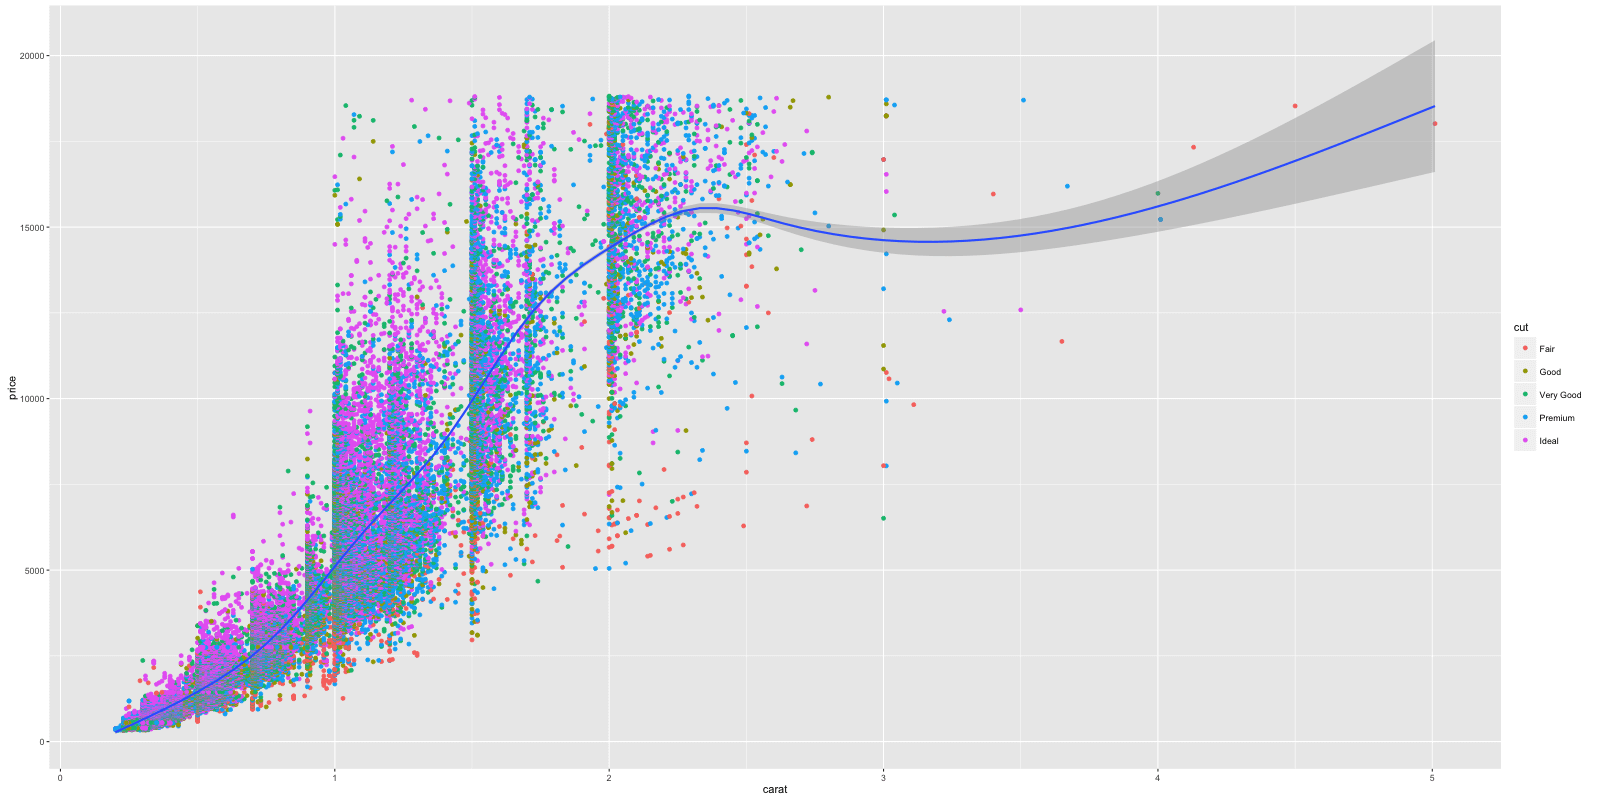
You will be introduced to ggplot2 and the idea that plots are built by combining:
- Data
- Aesthetic mappings
- Geometric layers
- Labels and scales
This provides a flexible way to explore and communicate patterns in restoration data.
Running the practical
This practical is implemented as an interactive notebook. Open the notebook in Google Colab:
Launch notebook
![]()
Next steps
In this exercise, you learn how to clean, structure, and visualise tabular data. In the next practical, you will build on this by:
- Working with climate variables over time
- Understanding time series data
- Exploring trends and how they are calculated