• Stories of Restoration
  • State of the Land
    • Reports
    • Tutorials
  • Events and Workshops
  • Dashboard
  • About K4GGWA
  • EN
  • FR

State of the Land Report 2025

Climate change
monitoring
Author

SPACIAL

Published

September 25, 2025

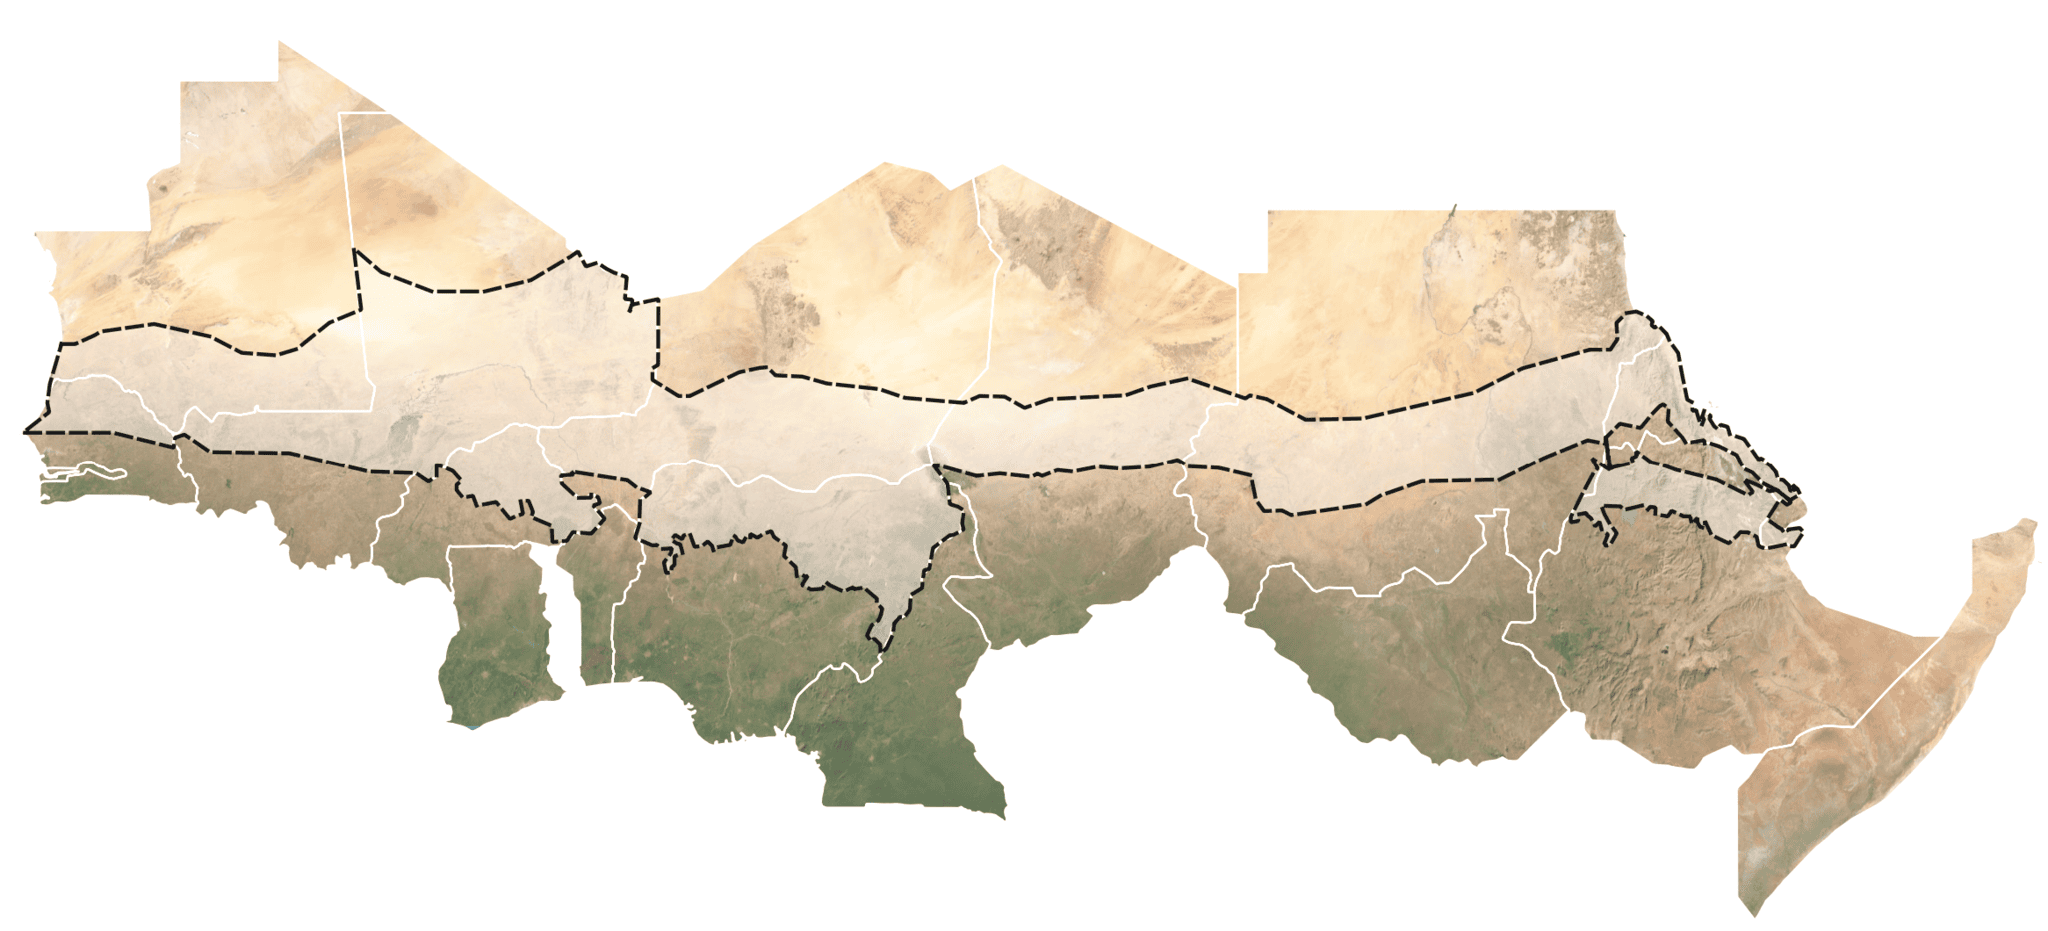
State of the Land: The Great Green Wall

Logo 1


Explore the Report

  • 1. What is the Great Green Wall?
  • 2. Historical framing & data gaps
  • 3. Beyond greening: what is land health, anyway?
  • 3a. Climate
  • 3b. Land cover
  • 3c. Soil health
  • 3d. Land degradation
  • 4. Conclusion

SUMMARY

The state of land health across the Great Green Wall region reflects a tightly interlinked system of climate, vegetation, soil, and degradation dynamics. Climate remains the primary limiting factor in these dryland ecosystems, governing the spatial and temporal patterns of rainfall and temperature that underpin vegetation growth and soil processes. Analysis of long-term climatic indicators shows persistent rainfall variability and rising temperatures, with certain areas experiencing intensified drought recurrence, such as central south Nigeria, and localised flood risk, like the Senegal River and Lake Chad Basins, demonstrating an increasingly volatile hydro-climatic regime.

tc_landscape

Land cover patterns respond directly to these climatic constraints. Satellite observations reveal dynamic patterns in tree and crop cover across the Sahel, reflecting both climate pressures and changes in land management. While some regions show persistent woody and crop cover, others exhibit decline linked to recurrent drought, land conversion, and fire disturbance. Fire occurrence remains a major driver of vegetation turnover, particularly in the savanna–woodland transition zones where rainfall and fuel conditions interact most strongly.

Soil health, assessed through soil organic carbon and soil moisture indicators, mirrors these land cover dynamics. Areas with higher vegetation cover tend to show higher soil moisture retention and SOC, while degraded or intensively cultivated areas exhibit depletion. Because soil health determines water infiltration, nutrient cycling, and the capacity of landscapes to buffer climate extremes, its deterioration exacerbates broader vulnerabilities to both drought and erosion.

Cumulatively, these factors shape observable trends in land degradation across the GGW region. Vegetation productivity (EVI) and erosion indicators highlight a mosaic of conditions, pockets of regreening and recovery next to zones of persistent or expanding degradation. Together, the evidence underscores that no single indicator acts in isolation, that climate determines opportunity, land cover and soils mediate response and degradation expresses the net outcome of their interaction. Strengthening positive feedbacks through vegetation recovery, soil restoration, and integrated land management remains central to building climate resilience and achieving the Great Green Wall’s vision of a productive, sustainable mosaic of land across the Sahel.

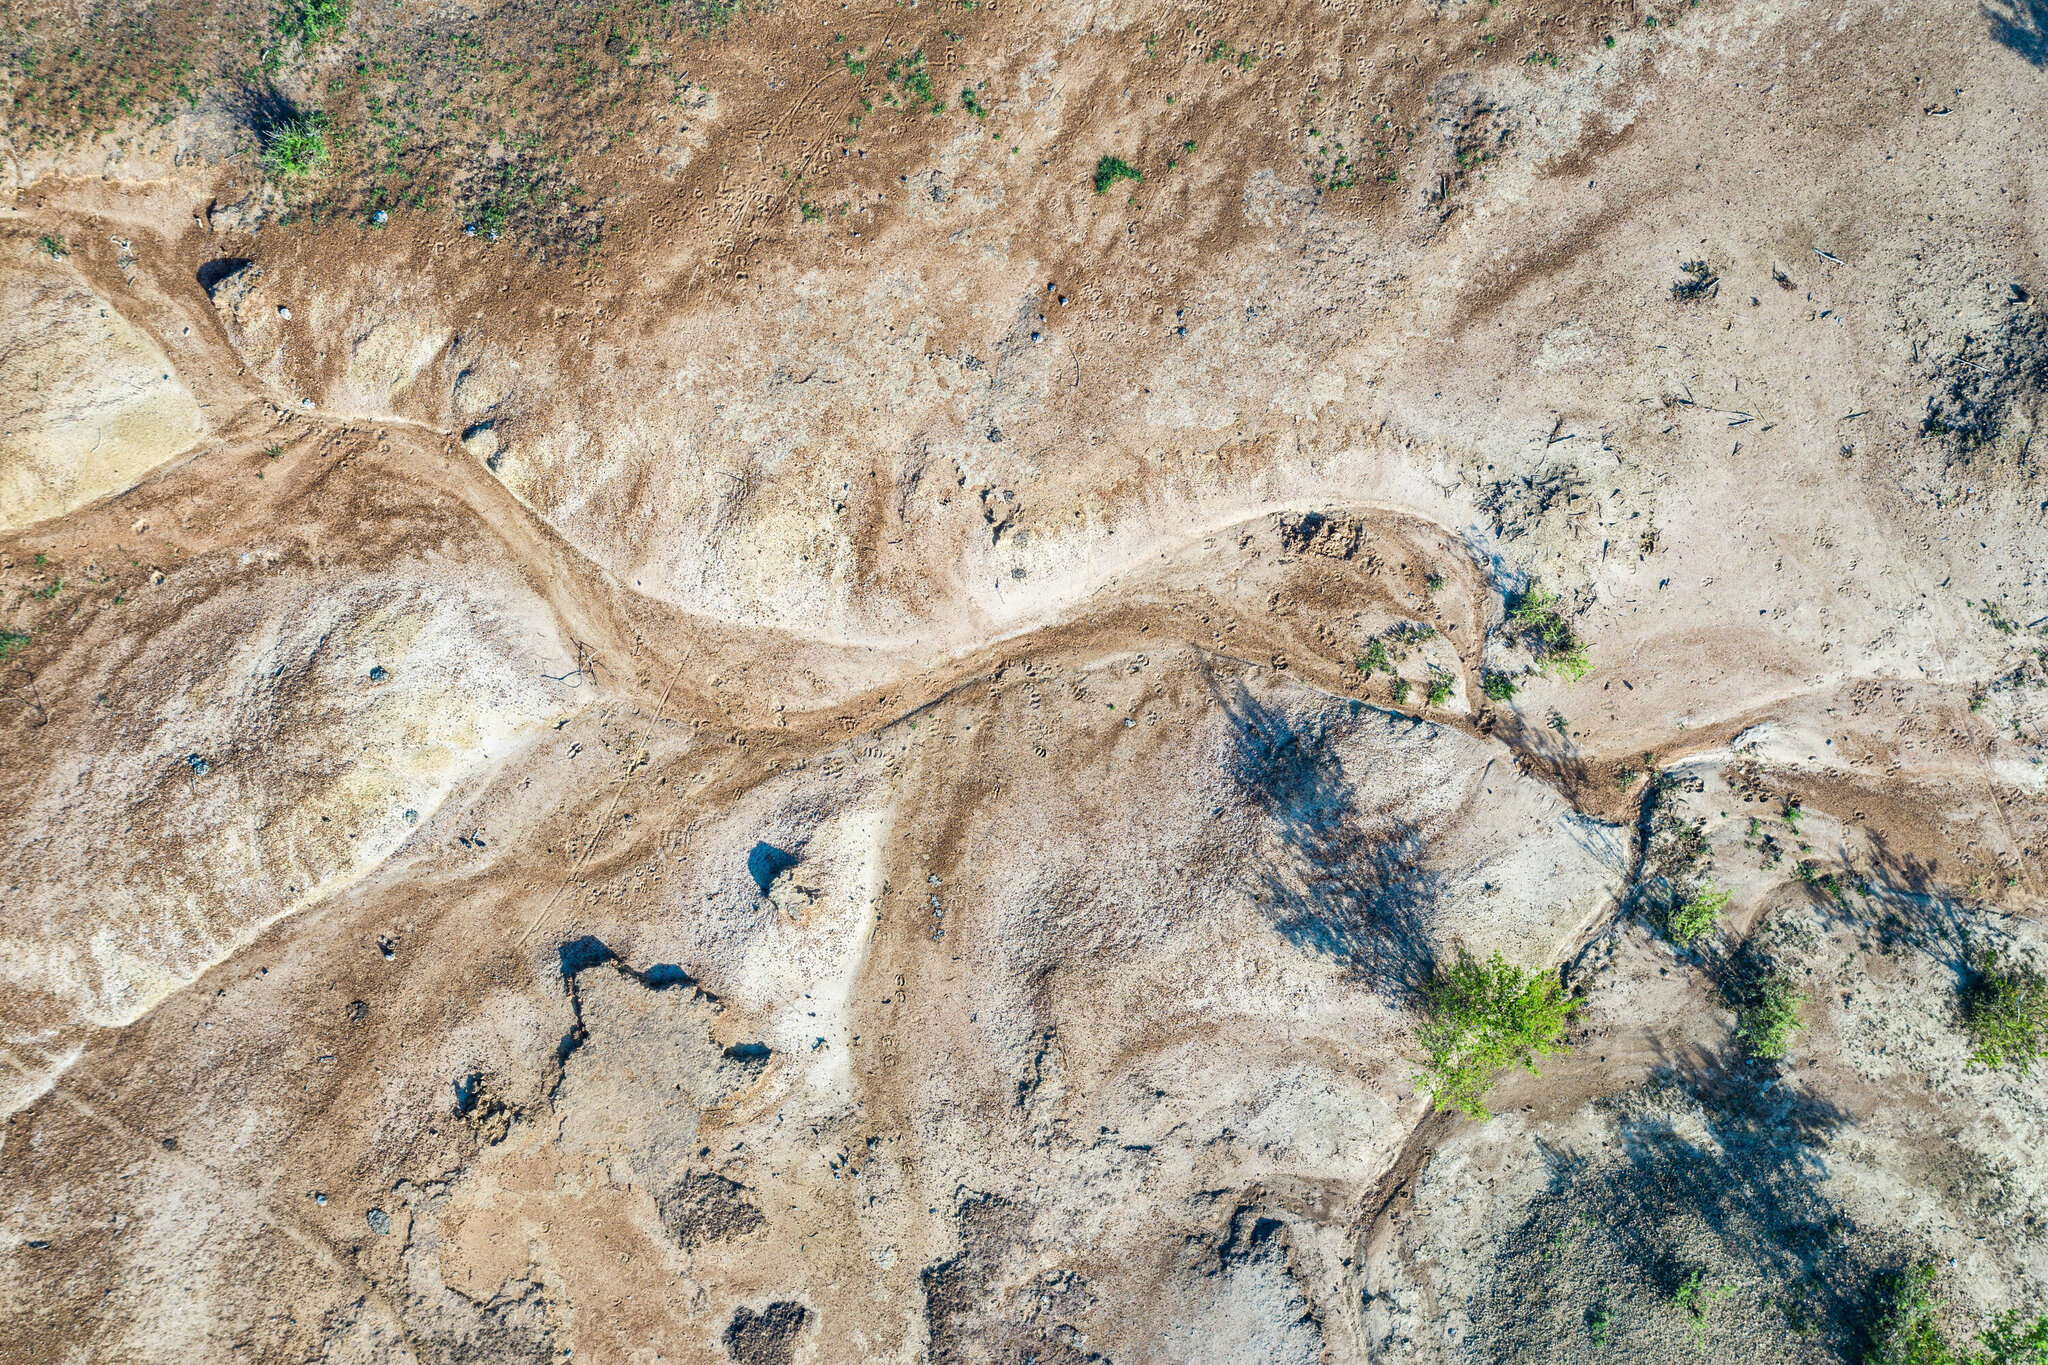
Once envisioned as a bold wall of trees to “hold back the desert”, the Great Green Wall (GGW) was borne from a narrative that painted the Sahel as a homogenous, desertifying frontier.

While ambitious, this conception was based on a simplistic understanding of the region’s ecological and social realities. Influenced by outdated views of the Sahel as a barren wasteland and a scarcity of data at the time, the early GGW narrative overlooked the complexity of the landscapes it sought to transform.

What is the Great Green Wall?

In reality, the Great Green Wall (GGW) region spans a vast and complex patchwork of ecosystems - from savannas and shrublands to seasonal wetlands and agro-pastoral systems - shaped by diverse ecological dynamics and millennia of human land stewardship.


Spanning 18 core countries, and more than 36 distinct ecoregions, the Great Green Wall is made up of a colorful mosaic of ecosystems and communities with diverse needs and on-ground realities. Restoration in these areas cannot be achieved with a single solution. What works in the Faidherbia-dotted plains of Senegal may not work in the seasonal floodplains of Chad or the dry highlands of Ethiopia.

NoteThe African Union

The GGW Initiative is coordinated by the Pan-African Agency for the Great Green Wall (PAGGW), under the umbrella of the African Union. Following the launch of the GGW Observatory, the AU released a 10-year strategy (2024–2034) that emphasizes data and evidence as central to project planning, implementation, monitoring, and reporting. You can read more about it in ‘AU GGW Initiative Strategy and 10-year Implementation Framework: Enhancing Ecosystems Restoration And Livelihoods Resilience (2024 - 2034)’

NoteThe Great Green Wall Accelerator

In 2021, the GGW Accelerator was launched to strengthen coordination, funding, and technical capacity. A joint effort of the UNCCD and the PAGGW, it aims to improve access to data, tools, and institutional support for effective project delivery and monitoring.

For much of its early history, the GGW was constrained by limited technical resources, fragmented data systems, and externally imposed metrics.

The growing adoption of earth observation (EO) and remote sensing (RS) technologies has transformed how Sahelian landscapes are understood. Today, we can track a range of ecosystem dynamics like soil erosion, tree cover, drought and flood risk, and fire frequency across vast areas with unprecedented precision.

Combined with improvements in African data infrastructure, such as national space and research agencies, continental soil and land health data hubs (like the Land Degradation Surveillance Framework (LDSF)), and stronger traditional ecological knowledge networks, these advances give us new clarity on how and why landscapes are changing, and how best to design and monitor interventions.

Rethinking land restoration across the GGW

This shift in capability also exposes the limits of traditional monitoring metrics like greening indices (e.g., NDVI), which often oversimplify complex processes. An apparent increase in vegetation cover for instance, may stem from rainfall increase, rising atmospheric \(CO_2\), or the spread of invasive species, none of which necessarily equate to meaningful restoration.

Greenness alone cannot reveal ecosystem function, soil recovery, biodiversity gains, or the sustainability of land use practices and in some cases, it risks masking degradation rather than identifying it.

Community-led restoration

Instead, what is needed is a framework for understanding land health across many different dimensions - one that integrates multiple indicators and measures not just increases in vegetation cover, but the recovery of soil health, biodiversity, climate resilience, and the well-being of communities who live on and steward the land.

Equally important is how these dimensions are monitored and who is involved. Across the Sahel, a growing number of initiatives are bridging local knowledge systems with digital technologies. Citizen science apps like Regreening Africa and participatory action research approaches are enabling communities to track restoration practices, ground-truth spatial datasets, and ensure that restoration monitoring aligns with lived realities.

Citizen-sci

In this sense, the GGW has the potential to be more than a restoration initiative but a vehicle for self-determination, driving local innovations for restoration of degraded land. By grounding monitoring frameworks in robust data that has been collected across a wide range of biophysical and social contexts, including varying community priorities, the GGW has the potential to strengthen the feedback loop between people, science and policy, ensuring restoration is both evidence based and socially and politically empowering.

Beyond greening: what is land health, anyway?

A deeper, more grounded understanding of restoration requires better tools for measuring change and interpreting it in ways that reflect realities on the ground. This means moving beyond single metrics like NDVI and adopting a suite of land health indicators that capture soil conditions, vegetation dynamics, climate risk and other dimensions of ecosystem function.

Land health refers to the capacity of soils, vegetation, and water systems to sustain ecological processes, support livelihoods, and withstand climatic shocks. Across the GGW region, this means soils that can absorb and hold rainfall, vegetation that regenerates after stress, and landscapes that provide services like forage, fuelwood, biodiversity habitat, and water regulation. Healthy land is therefore not simply land that is green, but land that is productive, resilient, and socially meaningful.

With earth observation (EO), or remote sensing (RS), now providing consistent and scalable data across the region, land health can be assessed through a suite of complementary indicators: soil organic carbon and erosion as measures of soil function, tree and crop cover as vegetation dynamics, fire, drought, and flood trends as disturbance and climate risks, and integrative indices like EVI trends to capture long-term vegetation change.

The following sections introduce this suite of land health indicators, showing how time-series analysis and spatial monitoring tools are uncovering trends, challenges, and opportunities in landscape change.

CLIMATE

Climate phenomena and drivers


The Sahel’s natural climate is complex and highly variable. In the west (Senegal, Mali, Mauritania), the West African Monsoon dominates, governed by the seasonal northward movement of the Intertropical Convergence Zone (ITCZ). Moist southwesterly winds from the Atlantic push inland during June–September, bringing the bulk of annual rainfall.

In central parts of the Sahel (Niger, Chad, northern Nigeria), this monsoon influence weakens with distance from the ocean, but rainfall is still tied to ITCZ movements. Further east (Sudan, Eritrea, Ethiopia), the East African Monsoon and influences from the Indian Ocean play a stronger role, interacting with highland topography to produce more complex rainfall regimes.

Across the entire Sahel, the Hadley Cell circulation largely determines aridity by bringing subsiding dry air, and in the dry season, the Harmattan winds sweep southward from the Sahara, carrying dust and intensifying evapotranspiration. Variability in sea surface temperatures from the Atlantic, Indian, and Pacific Oceans further modulates these systems, leading to highly unpredictable rainfall year-on-year.

Community-led restoration

Climate variability across space and time


Rainfall across the Sahel is marked by high variability, both in space and in time. A defining feature is the north–south rainfall gradient, often mapped using isohyets (lines of equal rainfall). These isohyets run roughly east–west and shift from about 200 mm annually at the desert fringe to 600–800 mm near the southern boundary of the Sahelian zone. Even small shifts in isohyets northward or southward can dramatically expand or contract cultivable land.

Temporally, the region experiences very high interannual variability. The devastating droughts of the 1970s and 1980s show how multi-decadal deficits can transform landscapes and societies. More recently, partial recovery in rainfall has been observed since the 1990s, though the distribution has become more erratic with delayed onset and early cessation of the rains, as well as heavier downpours interspersed with longer dry spells. These shifts in timing and intensity are often more consequential for farming and grazing than changes in total rainfall amounts.

Climate-vegetation dynamics


Vegetation across the Sahel is tightly coupled to these rainfall dynamics. Short, intense rainy seasons trigger rapid bursts of growth in grasses, shrubs, and crops, with plants storing resources to withstand long dry months. Where vegetation cover is sufficient, a positive feedback is created, shading the soil, reducing evaporation, and improving infiltration, which in turn sustains more growth.

Conversely, if rainfall is insufficient or vegetation cover declines, soils degrade, erosion accelerates, and the land loses its capacity to capture and retain water. The result is a system highly sensitive to small climatic shifts, with ecological thresholds that can tip landscapes toward either degradation or regeneration.

Community-led restoration

The Sahel’s climate-constrained agroecosystems and opportunities


Most agroecosystems in the Sahel are rainfed and therefore constrained by the short and variable rainy season. Crop yields, rangeland productivity, and even livestock health depend on the timing and quantity of rainfall. Because livelihoods are so climate-dependent, understanding trends and drivers becomes essential not only to anticipate risks but also to design interventions that work with natural dynamics. Nature-based and land management solutions that capture and store rainfall can help buffer this variability.

Practices such as soil and water conservation, contour bunds, half-moons, watershed management, and agroforestry allow landscapes to make better use of limited rainfall. By aligning interventions with climate patterns and tracking rainfall and vegetation trends, land managers and policymakers can guide restoration in ways that harness the Sahel’s natural climate system rather than struggle against it.

Explore the GGW climate dashboard

Rainfall
The map to the right shows long term (2001 - 2024) annual average rainfall (mm/year). Toggle and zoom the map to inspect how these rainfall patterns vary at finer spatial scales.

Precipitation across the GGW is highly variable, with a strong latitudinal gradient. At the fringes of the Sahara desert, rainfall can be a little as 200mm a year, while in the far south, rainfall can reach up to 1400mm.

There is of course, spatial variability within countries, as is visible in central Nigeria which in many parts exceeds 1000mm/year, or in Ethiopia, with high rainfall in the western highlands, and very low rainfall in the easternmost part.

As rainfall is a major limiting factor for vegetation productivity, understanding the spatial patterns of rainfall helps inform what kinds of land uses and restoration interventions are viable.

In low rainfall systems for example, tree planting may be infeasible, as new seedlings don’t receive the water required to grow. Instead, improving soil water retention may be a more practical approach, through SWC and other dryland restoration techniques.

Rainfall trends
It is important to not only understand the average amount of rainfall across the region, but the trends over time. The map to the right shows rainfall trends across the GGW from 2001 - 2024.

Regions with red pixels show a drying trend, while the blue pixels show overall wetting trends. We can see some positive trends in regions like southwestern Mali and Senegal, while others, like central Ghana, Nigeria and the Ethiopian highlands have seen a decline in annual rainfall. Northern bands of Mali and Mauritania have seen a mild drying trend.

These trends however, only tell us the direction and magnitude of change on an annual basis, but don’t reveal how these increases or decreases in rainfall have occurred.

We can disaggregate rainfall trends to examine the concentration of rainfall (i.e., are observed increases in rainfall evenly spread, or more concentrated across the year?) as well as the seasonality (i.e., are rains starting and stopping earlier than usual?).

Concentration and seasonality of rainfall
The chart to the right shows a time series of rainfall concentration for each country from 2001 - 2024, calculated using the precipitation concentration index (PCI). A higher PCI indicates greater concentration of rainfall - i.e., rainfall occurs during a narrow window of the year, while a lower PCI indicates that rainfall events are more evenly spread.

PCI fluctuates year to year, reflecting years with shorter or prolonged rainy seasons, or effects of major events like El Nino or La Nina years. This is visible in the peaks and dips across the time series.

In 2007 for example, we see a large spike across much of the Western Sahel, reflecting an anomalous monsoon season that year, where the bulk of rainfall occurred in a short time frame. In 2014 conversely, we see a dip, reflecting more even rains across the entire region. Caution should be taken when looking at rainfall trends averaged across large areas, especially countries spanning more than one rainfall regime, as much of the spatial variability is lost.

The way that rainfall occurs - the concentration, onset and cessation, whether it occurs during the day or night - is a key determinant of food and economic security, affecting everything from livestock prices to crop success and harvest time, accessibility to schools and markets, and decisions of whether or not to migrate.

Understanding rainfall patterns is essential to explain how and why vegetation across the GGW is changing, to guide the adaptation of farming and pastoral systems, and to anticipate extreme events such as floods and droughts.

As a primary driver of vegetation dynamics, rainfall helps distinguish climate-driven changes from those resulting from management, while also informing strategies that enhance rainfall capture and storage, mitigate climate extremes, and support adaptive land management.

Flood risk
Extreme rainfall events, or floods, occur when intense rainfall cannot infiltrate into the soil or be drained away, leading to the accumulation of surface water. In milder cases, floods erode soils, deposit sediment into waterways, and damage crops. In severe events, they destroy infrastructure and threaten lives. Flooding is thus both a hazard and a driver of land degradation.
The link between precipitation and flooding is particularly strong in the Sahel, where rainfall is highly variable (see previous section). Extended dry periods leave soils exposed, compacted, and with low absorptive capacity. When heavy downpours occur, water runs off rather than infiltrating into soils, increasing flood risk.
Flood risk is most pronounced along river systems, floodplains, and low-lying areas of the GGW region.
Senegal, with coastal exposure and large river basins, has the greatest surface area classified as medium to high flood risk. The 2024 floods exemplify how climate variability and degraded land surfaces combine to produce destructive events.
Restoration can mitigate flood risks by improving how landscapes capture, store, and release water.
Vegetation cover buffers soils against raindrop impact, stabilises slopes, and enhances infiltration through root systems. Organic matter inputs increase soil carbon and water-holding capacity. At broader scales, soil and water conservation measures, contouring, and watershed management shape microtopography to slow runoff; interventions like riparian buffers, mangrove restoration, and check dams reduce flood peaks and downstream impacts.
Together, these strategies highlight how land management and nature-based solutions can turn rainfall variability from a hazard into an opportunity for resilience. By integrating soil, vegetation, and water management, flood risks can be reduced while simultaneously restoring degraded lands across the GGW.


Across the GGW, drought remains one of the most persistent climate hazards. Multi-decadal droughts in the 1970s–80s drastically changed landscapes, however recent decades show partial rainfall recovery but with continued high variability. Shorter and more intense dry spells now occur within rainy seasons, compounding stress on crops, pastures, and water availability.

Defined as a prolonged period of time without rainfall relative to normal conditions, droughts leads to soil moisture loss, reduced vegetation growth, and water shortages. It is a critical indicator in the Sahel, where livelihoods are highly dependent on rainfed farming and grazing.

The map to the right shows rainfall deficit trends (SPI-3)from 2001 - 2024. In Ethiopia’s eastern lowlands, recurrent drought has reduced grazing potential and accelerated land degradation, driving food insecurity and migration. Persistent drought in central eastern parts of Somalia has led to an ongoing humanitarian crisis of food insecurity.

Degraded soils and minimal vegetation cover intensify impacts, as landscapes lose their capacity to store rainfall and sustain productivity. Recovery depends on both the return of favorable rainfall and the presence of healthy soils and vegetation able to capture and use it effectively. Restoration practices in drought prone areas can promote soil water retention, buffering against climate impacts.

Drought is both a climatic event and a measure of ecosystem resilience. Tracking its frequency, duration, and severity alongside vegetation, soil, and rainfall indicators is essential for identifying vulnerable areas and guiding restoration strategies that build long-term drought resilience.


Temperature is another dimension of climate stress across the Sahel and a critical determinant of how rainfall variability translates into land productivity. While precipitation can determine when and where vegetation grows, temperature defines how long they can sustain growth before moisture is lost.

Across the GGW region, both day and night-time land surface temperatures have risen steadily since the early 2000s, with warming most pronounced in the western Sahel and central Sudanian zones. This upward trend, combined with persistent heat extremes, is reshaping the water balance and vegetation dynamics across all major land-use systems.

Even where rainfall totals have remained stable, higher temperatures increase evapotranspiration, reducing soil moisture availability and shortening growing periods. Hotter conditions also increase heat stress on crops and pastures, heighten wildfire risk, and speed up soil organic carbon loss.

In this way, temperature is a key modulator, turning moderate rainfall deficits into more severe ecological stress and reducing the resilience of restored or cultivated landscapes.

The map to the right illustrates high spatial variability in land surface temperature trends. Warmer zones correspond closely with areas of low vegetation cover and declining soil moisture, showing how thermal stress compounds other climate risks. Understanding these spatial relationships is central to targeting restoration efforts that seek to mitigate thermal stress associated with warming trends.

LAND COVER


Land cover across the Sahel has changed markedly over the past three decades. The region’s landscape, once dominated by open grasslands and shrub savannas with scattered croplands, now withstands pressures from increasing climatic variability and land use change. Expanding populations and urban footprints, shifts in livelihood activities, and changes in land management have altered surface cover and ecological processes.

Since the 1990s in particular, agricultural land has expanded as demand for food and cash crops has increased. Traditional fallow systems have reduced, and cultivation now extends into more marginal, erosion-prone areas. Urban and peri-urban expansion has further reduced natural vegetation, while infrastructure growth and overstocking has fragmented rangelands and woodland systems. In some areas, soil fertility and productivity have declined under continuous use and limited restoration, though yield improvements from better inputs and management have offset losses in others.

At the same time, climatic stress, especially drought and erratic rainfall has driven both degradation and recovery. Vegetation losses have occurred where soil and water resources are under pressure, but increases in woody cover have also been observed, particularly in regions with farmer-managed natural regeneration or community-led restoration. The is a result of widespread agricultural intensification, localized regreening, and persistent degradation in vulnerable zones.

tc_landscape


This report focuses on three complementary indicators:

  • Tree cover is a critical measure of woody biomass, carbon storage, and agroforestry potential.

  • Crop cover reflects the area under cultivation.

  • Fire occurrence can indicate disturbance regimes that shape both tree and grass dynamics.

    Declining tree or crop cover often signals land degradation linked to soil erosion, overgrazing, or climate stress. Conversely, positive vegetation trends can point to natural regeneration or successful management interventions.

    By monitoring land cover trends consistently, decision-makers can identify priority zones for restoration, evaluate the effectiveness of ongoing projects, and anticipate risks. This evidence base supports nature-based solutions such as farmer-managed natural regeneration, rangeland management, and fire control, and can help direct investments in areas with the highest potential for regreening.

Explore the GGW land cover dashboard

Tree cover
Tree cover is a key indicator of woody biomass, carbon storage, biodiversity habitat, and the availability of ecosystem services such as shade, fuelwood, and non-timber products. In the Sahel, trees and woody vegetation also play a critical role in buffering against land degradation by stabilizing soils, reducing wind erosion, and enhancing water infiltration.

Loss of tree cover is driven primarily by agricultural expansion, overharvesting of wood, grazing pressure, and recurrent fire. Climate variability and prolonged droughts further weaken regeneration capacity. Recovery is possible however through protective measures like gazetting for community woodlots and natural regeneration, agroforestry, and protection of riparian and gallery forests, all of which can restore both ecological and livelihood functions.

Across the GGW, forest cover is highly uneven, with denser stands in wetter southern zones and along rivers, while northern areas are sparsely treed. Long-term monitoring shows declines in several regions under cultivation and fuelwood demand, but also localised gains where FMNR and restoration projects have taken place.

In southern Niger, FMNR has led to millions of naturally regenerated trees on farmland, improving soil fertility and local microclimates. In Senegal’s Ferlo region, pressures from grazing and fuelwood collection have caused steady declines in tree density, leaving soils more exposed and vulnerable to erosion. These examples show both the vulnerability of woody resources and their potential to rebound under supportive management.

Forest cover trends can be a strong measure of land condition and restoration potential in the Sahel. Sustaining and restoring woody vegetation is central not only for carbon and biodiversity goals but also for building resilient agroecosystems and livelihoods.

Crop cover
Cropland across the Great Green Wall region is shaped by both climatic limits and long-term land-use pressures. Agriculture is largely rainfed and concentrated in the southern Sahel and Sudanian zones, where rainfall is more reliable.

The map alongside shows cropland concentration in certain regions like the Senegalese Peanut Basin, the Niger River corridor, northern Nigeria, and around Lake Chad and Sudan, areas with strong regional food production and rural livelihoods.

Over the past two decades, satellite data reveal a mixed pattern of cropland expansion in parts of the western Sahel, driven by population growth and market access, contrasts with stagnation or decline in central and eastern areas where rainfall has become less dependable and soils increasingly degraded. In some localities, woody encroachment linked to regreening has also altered the agricultural mosaic.

These shifts have direct implications for land health. Expansion into marginal lands heightens erosion and soil carbon loss, while well-managed cropland especially under agroforestry or FMNR systems can help retain soil structure and moisture. Tracking crop cover alongside rainfall and vegetation indicators provides insight into how land use is adapting to climate variability and where agricultural transitions may be reinforcing or undermining resilience across the GGW.

Fire occurrence
Fire maps indicate where and how often landscapes burn. Fire in the Sahel is a complex driver of landscape change and is neither inherently positive nor negative; its impact depends on timing, climate conditions, and the amount of fuel available. In wetter years, when grasses and shrubs produce abundant biomass, fire risk and intensity increase.

If these burns occur too frequently or at the wrong time of year, they can deplete soil cover, suppress tree regeneration, and accelerate degradation. At the same time, fire also plays a natural ecological role in maintaining open savannas, recycling nutrients, and reducing pest pressures.

Fire frequency hostpots across the GGW show intensifying fire occurrence in the eastern Tambacounda region of Senegal, the Northern and North Eastern regions of Ghana and the Zamfara and Borno regions of Nigeria. Conversely, some areas like the southeastern part of the Chad Basin, have seen a declining trend.

When managed carefully, fire can be a powerful restoration tool, used to control woody encroachment, stimulate grass growth, create firebreaks that protect vulnerable areas, and used as a climate mitigation strategy. The balance lies not in eliminating fire but in aligning it with natural ecosystem dynamics and land management goals, turning what is often seen as a threat into a means of supporting resilient landscapes.

SOIL HEALTH

Soil types across the GGW


Soils across the Great Green Wall region are shaped by climatic gradients, topography, and underlying geology, amongst other factors. In the west (Senegal, Mauritania, Mali), sandy Arenosols and Regosols dominate. These are typically light-textured soils formed from aeolian sands that drain quickly but have low fertility and organic matter. Moving eastward through Niger and Chad, these turn into Luvisols and Leptosols on uplands and shallow plateaus, with pockets of Vertisols and Fluvisols in low-lying valleys and floodplains, especially along the Niger and Chari rivers. Further east, in Sudan and Ethiopia, clay-rich Vertisols and Nitisols become more common, reflecting stronger monsoonal rainfall and basaltic parent materials.

tc_landscape
Across the region, soil depth and texture vary dramatically even within short distances, shaping how water moves through the landscape and how vegetation establishes. The prevalence of crusting, compaction, and erosion in degraded areas limits infiltration and nutrient cycling, reducing the resilience of both soils and vegetation.

Climate–vegetation–soil feedbacks


Soil processes are tightly coupled to climatic and ecological dynamics described in the previous sections. Rainfall patterns shape soil formation, leaching, and erosion, while soil properties in turn determine how rainfall infiltrates, is stored, or lost as runoff.

Vegetation roots bind and stabilise soils, while its canopy reduces evaporation and buffers erosion. When vegetation cover is lost or rainfall becomes erratic, soils can become exposed to intense erosion and desiccation, degrading their capacity to store water and nutrients. This initiates a feedback loop whereby degraded soils support less vegetation, which in turn worsens runoff and reduces rainfall infiltration, further minimising the soil’s ability to support vegetation.

tc_landscape

Landscapes under sustainable land cover types like natural savannas, grasslands, or managed agroforestry systems, on the other hand, can maintain continuous root networks and organic inputs that build soil organic carbon and moisture. Practices like Farmer-Managed Natural Regeneration (FMNR) or soil and water conservation techniques restore this positive cycle, improving infiltration, nutrient cycling, and resilience to climatic stress.

Healthy soils rich in organic matter and moisture thus underpin the entire land–climate system, mediating exchanges in energy, water, and nutrients across Sahelian landscapes and determining their capacity to recover and thrive under increasing climatic variability.

Soil health indicators: SOC and moisture


This report focuses on two soil health indicators critical to understanding degradation trends:

  • Soil Organic Carbon (SOC) - a key determinant of soil fertility, aggregation, and biological activity. SOC reflects the balance between biomass input and decomposition, serving as both a measure of land productivity and a carbon sink that links restoration to global climate goals.

  • Soil moisture - an indicator of the soil’s capacity to absorb and retain water. It mediates nearly every land–atmosphere exchange process in the Sahel, influencing evapotranspiration, vegetation growth, and the onset and persistence of drought.

Together, these indicators show how land use, vegetation, and climate interact to shape landscape function. Tracking their spatial and temporal dynamics allows restoration planners and policymakers to identify hotspots of degradation or resilience, target interventions, and monitor recovery trajectories across the Great Green Wall.

Explore the GGW soil health dashboard

Soil Organic Carbon (SOC)
There is a general southward positive gradient, with higher SOC in wetter southern zones, but also localised pockets of relatively high SOC in drier areas where soils, vegetation, or management practices favor accumulation.

SOC is lost when vegetation cover declines and soils are left exposed to erosion, high temperatures, and become mineralised. Overgrazing, intensive cultivation, and repeated burning accelerate these losses, while recovery is supported by practices that increase biomass inputs and reduce disturbance, such as agroforestry, FMNR, mulching, and soil and water conservation.

Trends across the GGW suggest that while SOC is generally higher in the southern margins, large areas show depletion, particularly in zones of high erosion and cultivation pressure. Areas of high are visible where vegetation recovery has been coupled with management interventions, highlighting the potential for SOC to rebound when soils are stabilised and organic matter is returned.

For example, in farmer-managed natural regeneration has been shown to increase woody cover and root biomass, supporting gradual SOC recovery. In parts of Senegal, SOC declines are found in zones of repeated flooding and erosion, demonstrating how land degradation processes strip away topsoil and organic matter. These contrasting cases illustrate both the fragility of SOC in degraded systems and its potential for recovery under sustainable management.

SOC is a powerful inidcator for assessing both degradation and restoration. Unlike vegetation indices that may capture only surface greening, SOC reflects deeper ecosystem processes. Monitoring SOC changes across the Sahel helps identify where soils are most fertile, functioning as stores of carbon and water, and where interventions are most urgently needed.

LAND DEGRADATION


Land degradation refers to the decline of ecosystem functions and the natural resource base that sustain life and livelihoods. Across the Sahel, degradation reduces the land’s ability to provide ecosystem services such as food, forage, water regulation, and carbon storage. It occurs when soils lose fertility and structure, vegetation cover is reduced, and landscapes become less resilient to climatic variability and shocks.

The UNCCD’s Global Land Outlook (2022) identifies the Sahel as one of the world’s most extensive zones of ongoing land degradation, where human pressures and climatic stressors converge to create a “degradation–poverty–vulnerability” feedback loop. Yet, it also remains one of the most dynamic landscapes for regreening and restoration, where local initiatives have reversed degradation at scale.

This report highlights two broad indicators of degradation: EVI and erosion. EVI trends capture long-term vegetation dynamics, distinguishing areas that are greening from those that are browning or in decline. Erosion reveals the physical loss of topsoil, the most fertile and structurally important layer, which undermines productivity and accelerates cycles of degradation.

Together these indicators help diagnose the severity and extent of land degradation across the Great Green Wall area. They show where ecosystem functions are declining, and where interventions are most needed.

tc_landscape

Here we focus on two main indicators:

  • EVI (Enhanced Vegetation Index) trends capture long-term vegetation dynamics and help distinguish greening from browning patterns across the region.

  • Erosion - indicates the severity of loss of topsoil, the most fertile and structurally important layer of soil

Explore the land degradation dashboard

EVI
The Enhanced Vegetation Index (EVI) provides a long-term measure of vegetation greenness trends across the Sahel and wider region. Unlike a single-year snapshot, this map captures persistent increases or declines in vegetation productivity over two decades, filtering out short-term rainfall fluctuations to highlight underlying change.

Because EVI reduces soil-background and atmospheric noise, it is particularly well-suited for Sahelian landscapes where bright soils and dust can confound simpler indices like NDVI. In this trend analysis, green areas mark places where EVI has increased over time, while red areas indicate consistent declines.

Increasing EVI trends are visible across much of the southern Sahel and savanna zones. These gains are partly linked to shifts in rainfall, as the 2000s and 2010s were wetter than the drought-prone 1980s and 1990s.

These areas may also align with sites of farmer-managed natural regeneration (FMNR), soil-water conservation structures, or where active restoration programs have taken place. In some rangelands, increases in woody cover and shrub encroachment may also drive upward EVI trends, reflecting changes in vegetation composition as well as overall greenness.

Declining EVI trends are clear in zones with high population densities and urban footprint. Most demonstrably across central Nigeria, with concentrated declines in vegetation around Abuja, the national capital, as well as in rapidly expanding commercial cities like Lagos, and Port Harcourt. Similar trends are visible around Accra in Ghana, Addis Ababa in Ethiopia, and Mogadishu in Somalia.

In other areas, such as around Lake Chad and northern Benin, heavy cultivation, overgrazing, fuelwood harvesting, repeated burning, and soil erosion prevent vegetation from recovering even in good rainfall years. In addition, local climatic stresses such as delayed onset or earlier cessation of the rainy season can compound degradation, leaving landscapes more vulnerable to persistent decline.

EVI shows, particularly across dryland systems, that vegetation responses are not uniform and that they reflect interconnected processes of climate, land use, and management. By interpreting EVI alongside complementary indicators such as tree cover, cropland extent, and fire occurrence, climate-driven fluctuations can be separated from human-driven degradation or recovery, and a deeper understanding of the mosaic of change unfolding across the GGW can be understood.

Erosion
Soil erosion is one of the clearest indicators of land degradation in the Sahel, reflecting the physical loss of fertile topsoil through wind and water. Patterns of erosion are highly variable, but generally intensify moving northward into drier zones with sparse vegetation and lots of wind activity. Steeper slopes, floodplains, and overgrazed rangelands are also hotspots where runoff or wind easily strips unprotected soils.

Erosion is driven by the removal of protective vegetation cover, poor land management, and extreme rainfall events. Prolonged dry periods can leave soils bare and crusted, and intense storms create concentrated runoff that denude topsoils. Wind erosion is severe in exposed sandy soils, especially where overgrazing reduces grass cover. Recovery requires restoring vegetation, improving soil structure, and implementing measures that reduce runoff velocity and wind exposure.

Across the GGW, erosion risk remains widespread, particularly in areas experiencing greater rainfall variability and land use pressure. Regions with declining vegetation cover or intensive cultivation show strong erosion signatures, while restoration sites with soil and water conservation structures demonstrate measurable reductions in erosion over time.

Localised interventions like in northern Burkina Faso, like zai pits and contour bunds have successfully reduced erosion by capturing runoff and stabilising soils, allowing vegetation to re-establish. In contrast, eastern Chad shows extensive erosion linked to overgrazed rangelands and shifting rainfall patterns, where loss of topsoil has reduced productivity and resilience. These examples underscore both the severity of erosion under degradation and the tangible benefits of targeted interventions.

Erosion is not only a symptom of land degradation but also a process that accelerates it, driving a cycle of soil loss and declining productivity. Monitoring erosion alongside SOC and vegetation indicators provides a more complete picture of land condition and restoration potential across the Sahel.

WHAT NEXT FOR THE GGW?

The GGW initiative is no longer defined by its early vision of a continuous “wall of trees” but instead, is increasingly understood as a mosaic of diverse ecosystems, livelihoods, and land uses across the Sahel. These landscapes deliver many different ecosystem services like carbon storage, soil fertility, grazing resources, water regulation, and biodiversity habitat, that cannot be measured by simple greening signals alone.

tc_landscape

Earth observation and remote sensing are now central to this evolving vision and can provide scalable, consistent, and cost-effective ways to monitor the region’s complexity, allowing tracking not just of vegetation cover, but also soil organic carbon, erosion, fire, drought, and climate risks. Together, these indicators provide a more accurate picture of land conditions and change, informing where restoration is most needed, where it is working, and how it can be better designed.

The indicators explored in this report reveal complex degradation and recovery trends. Some areas show signs of recovery through vegetation regrowth and improved soil function, while others exhibit cycles of degradation or increasing vulnerability to climate extremes. No single indicator can tell the full story, but by integrating multiple lines of evidence can we start to understand real land health dynamics across the region.

Looking ahead, the challenge is to translate this evidence into action. Restoration under the Great Green Wall must be guided by data that reflects the realities of Sahelian landscapes, enabling better targeting of interventions, adaptive management, and long-term monitoring. By incorporating diverse land health indicators, the GGW can deliver restoration that is both ecologically meaningful and socially transformative.

tc_landscape

Back to top

Logo 1

Contents

  • 1. What is the GGW?
  • 2. Land Health
  • 3. Climate
  • 4. Land Cover
  • 5. Soil Health
  • 6. Land Degradation

Back to top