Drought prevalence in the Sahel region
Drought prevalence in the Sahel region
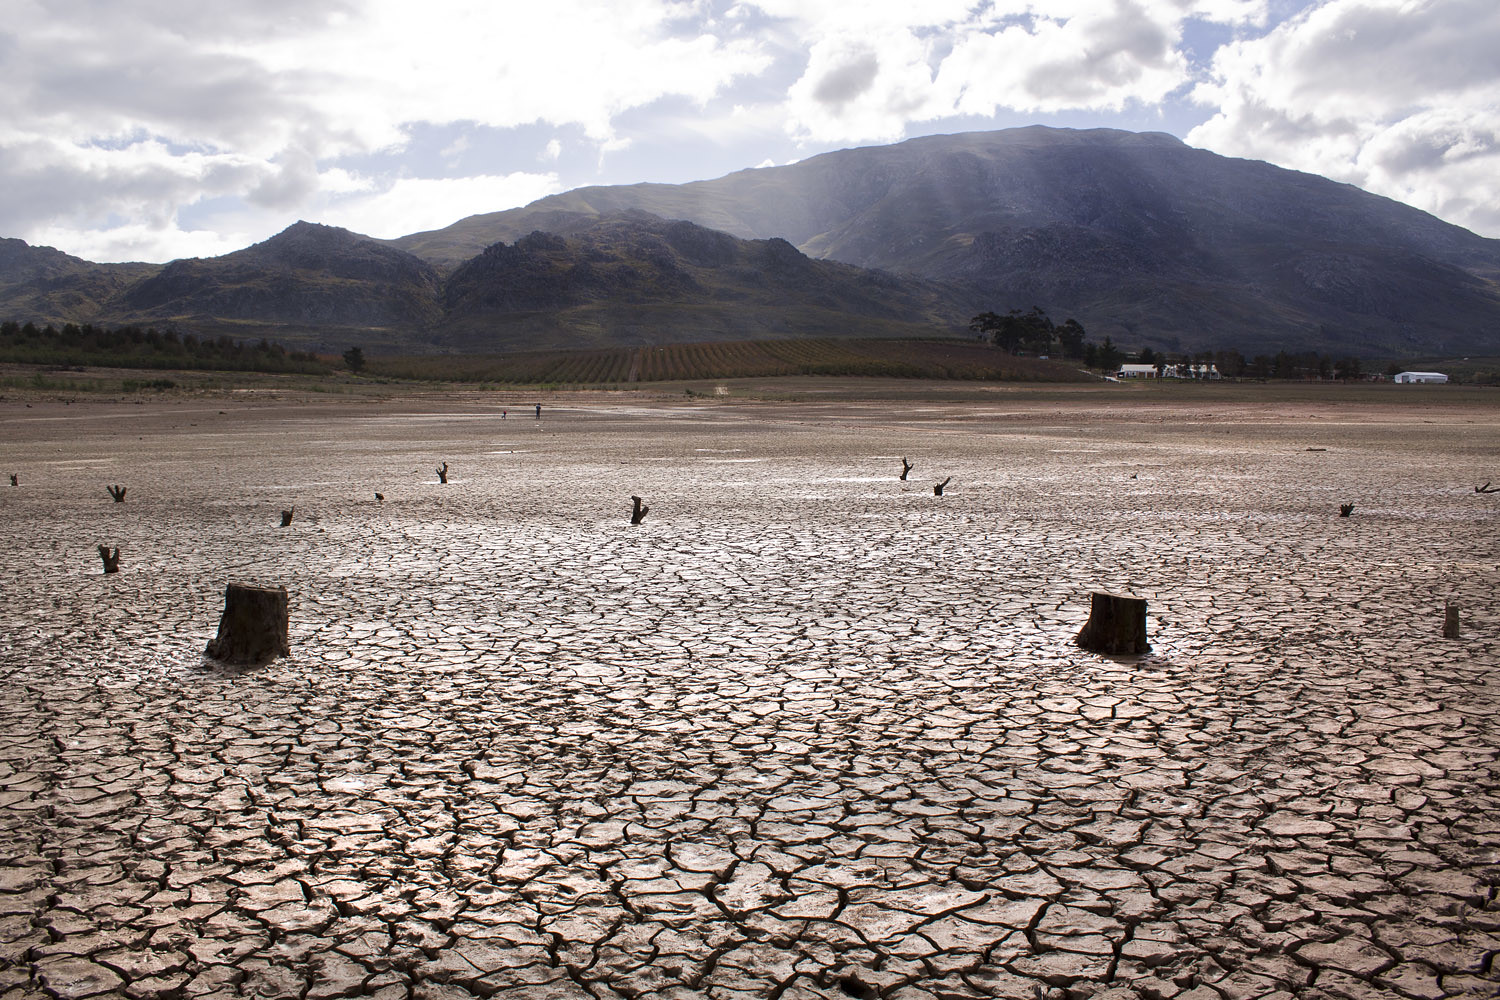
The Sahel region in Africa faces challenges from recurring droughts that threaten food security, livelihoods, and ecosystems. Over the past decades, dry spells have led to humanitarian crises in the region due to crop failures, livestock losses, and ecosystem degradation. These droughts are particularly devastating in the arid and semi-arid region of the Sahel where communities rely heavily on the land.
Monitoring drought patterns is crucial for identifying vulnerable areas and populations at risk. Long-term drought monitoring provides valuable data for understanding climate change impacts and developing adaptation strategies. This information can guide policymakers and stakeholders in implementing effective interventions.
The Great Green Wall initiative is an ambitious African-led project that aims to restore degraded landscapes across the Sahel region. Launched in 2007, this project spans 8,000 km across the width of Africa, from Senegal in the west to Djibouti in the east. The initiative supports local communities through ecosystems preservation and restorations, as well as sustainable land management. All this with the aim to improve ecosystem health and increase community resilience to future climate shocks.
What do we mean by drought?
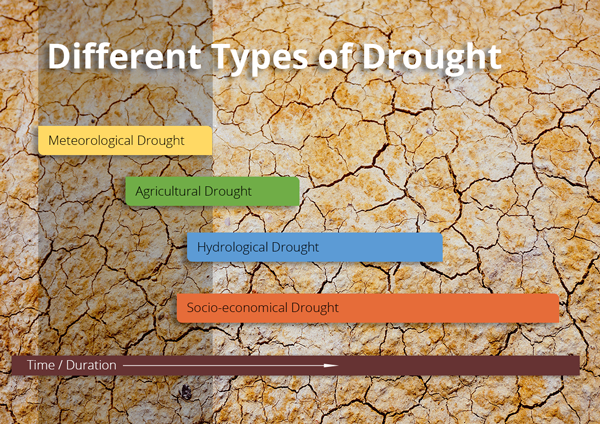
Droughts have adverse effects on both ecosystem and communities. Though they can be assessed through various lenses. Generally, we distinguish between four types of drought based on the impacts:
1. Meteorological Drought – Occurs when there is a prolonged period of below-average precipitation. This type of drought is typically the first stage of a drought event.
2. Agricultural Drought – Characterised by reduced soil moisture below what is needed for crop growth and pasture health, often due to insufficient rainfall or excessive evaporation. Since agricultural droughts are characterised by decreased vegetation productivity and biomass, they can be measured through satellites images.
3. Hydrological Drought – Results from long-term water shortages in rivers, lakes, and groundwater, affecting water supply for households, agriculture, and industry.
4. Socioeconomic Drought – Occurs when drought conditions disrupt economic and social activities, such as food production, water supply, and livelihoods. Depending on the community resillience, socioeconomic drought follows the other drought types directly or with some lag.
.
Here, we focus on agricultural drought, which directly impacts food production and rural livelihoods. The Great Green Wall region has historically been affected severely by droughts due to its reliance on rain-fed farming. In this context, drought have led to:
Crop failure and declining yields: Low water availability makes it difficult for crops to grow, threatening food security.
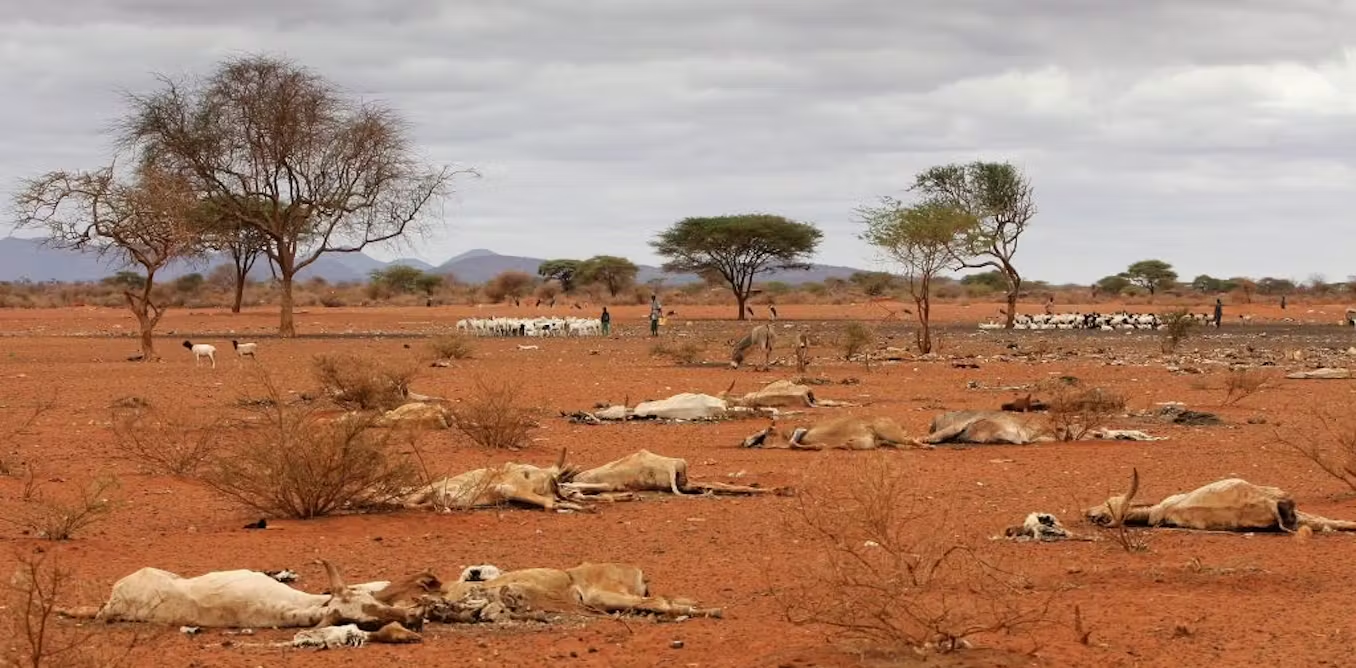
Loss of livestock: Pastoral communities struggle as grasslands dry up, leading to malnutrition and economic losses.
Soil degradation: Persistent drought weakens the soil structure, increases erosion and reduces soil fertility.
.
Monitoring droughts from the sky
Agricultural droughts can be effectively monitored using satellites. Satellites provide continuous and large-scale observations of vegetation and soil moisture conditions, helping to assess drought severity, duration, and spatial extent. We use the Vegetation Condition Index (VCI) which is a widely used indicator for detecting droughts. The VCI is derived from the NDVI and assesses the vegetation conditions compared to historical levels.
It is calculated as following: \[
VCI = \frac{NDVI - NDVI_{min}}{NDVI_{max} - NDVI_{min}} \times 100
\]
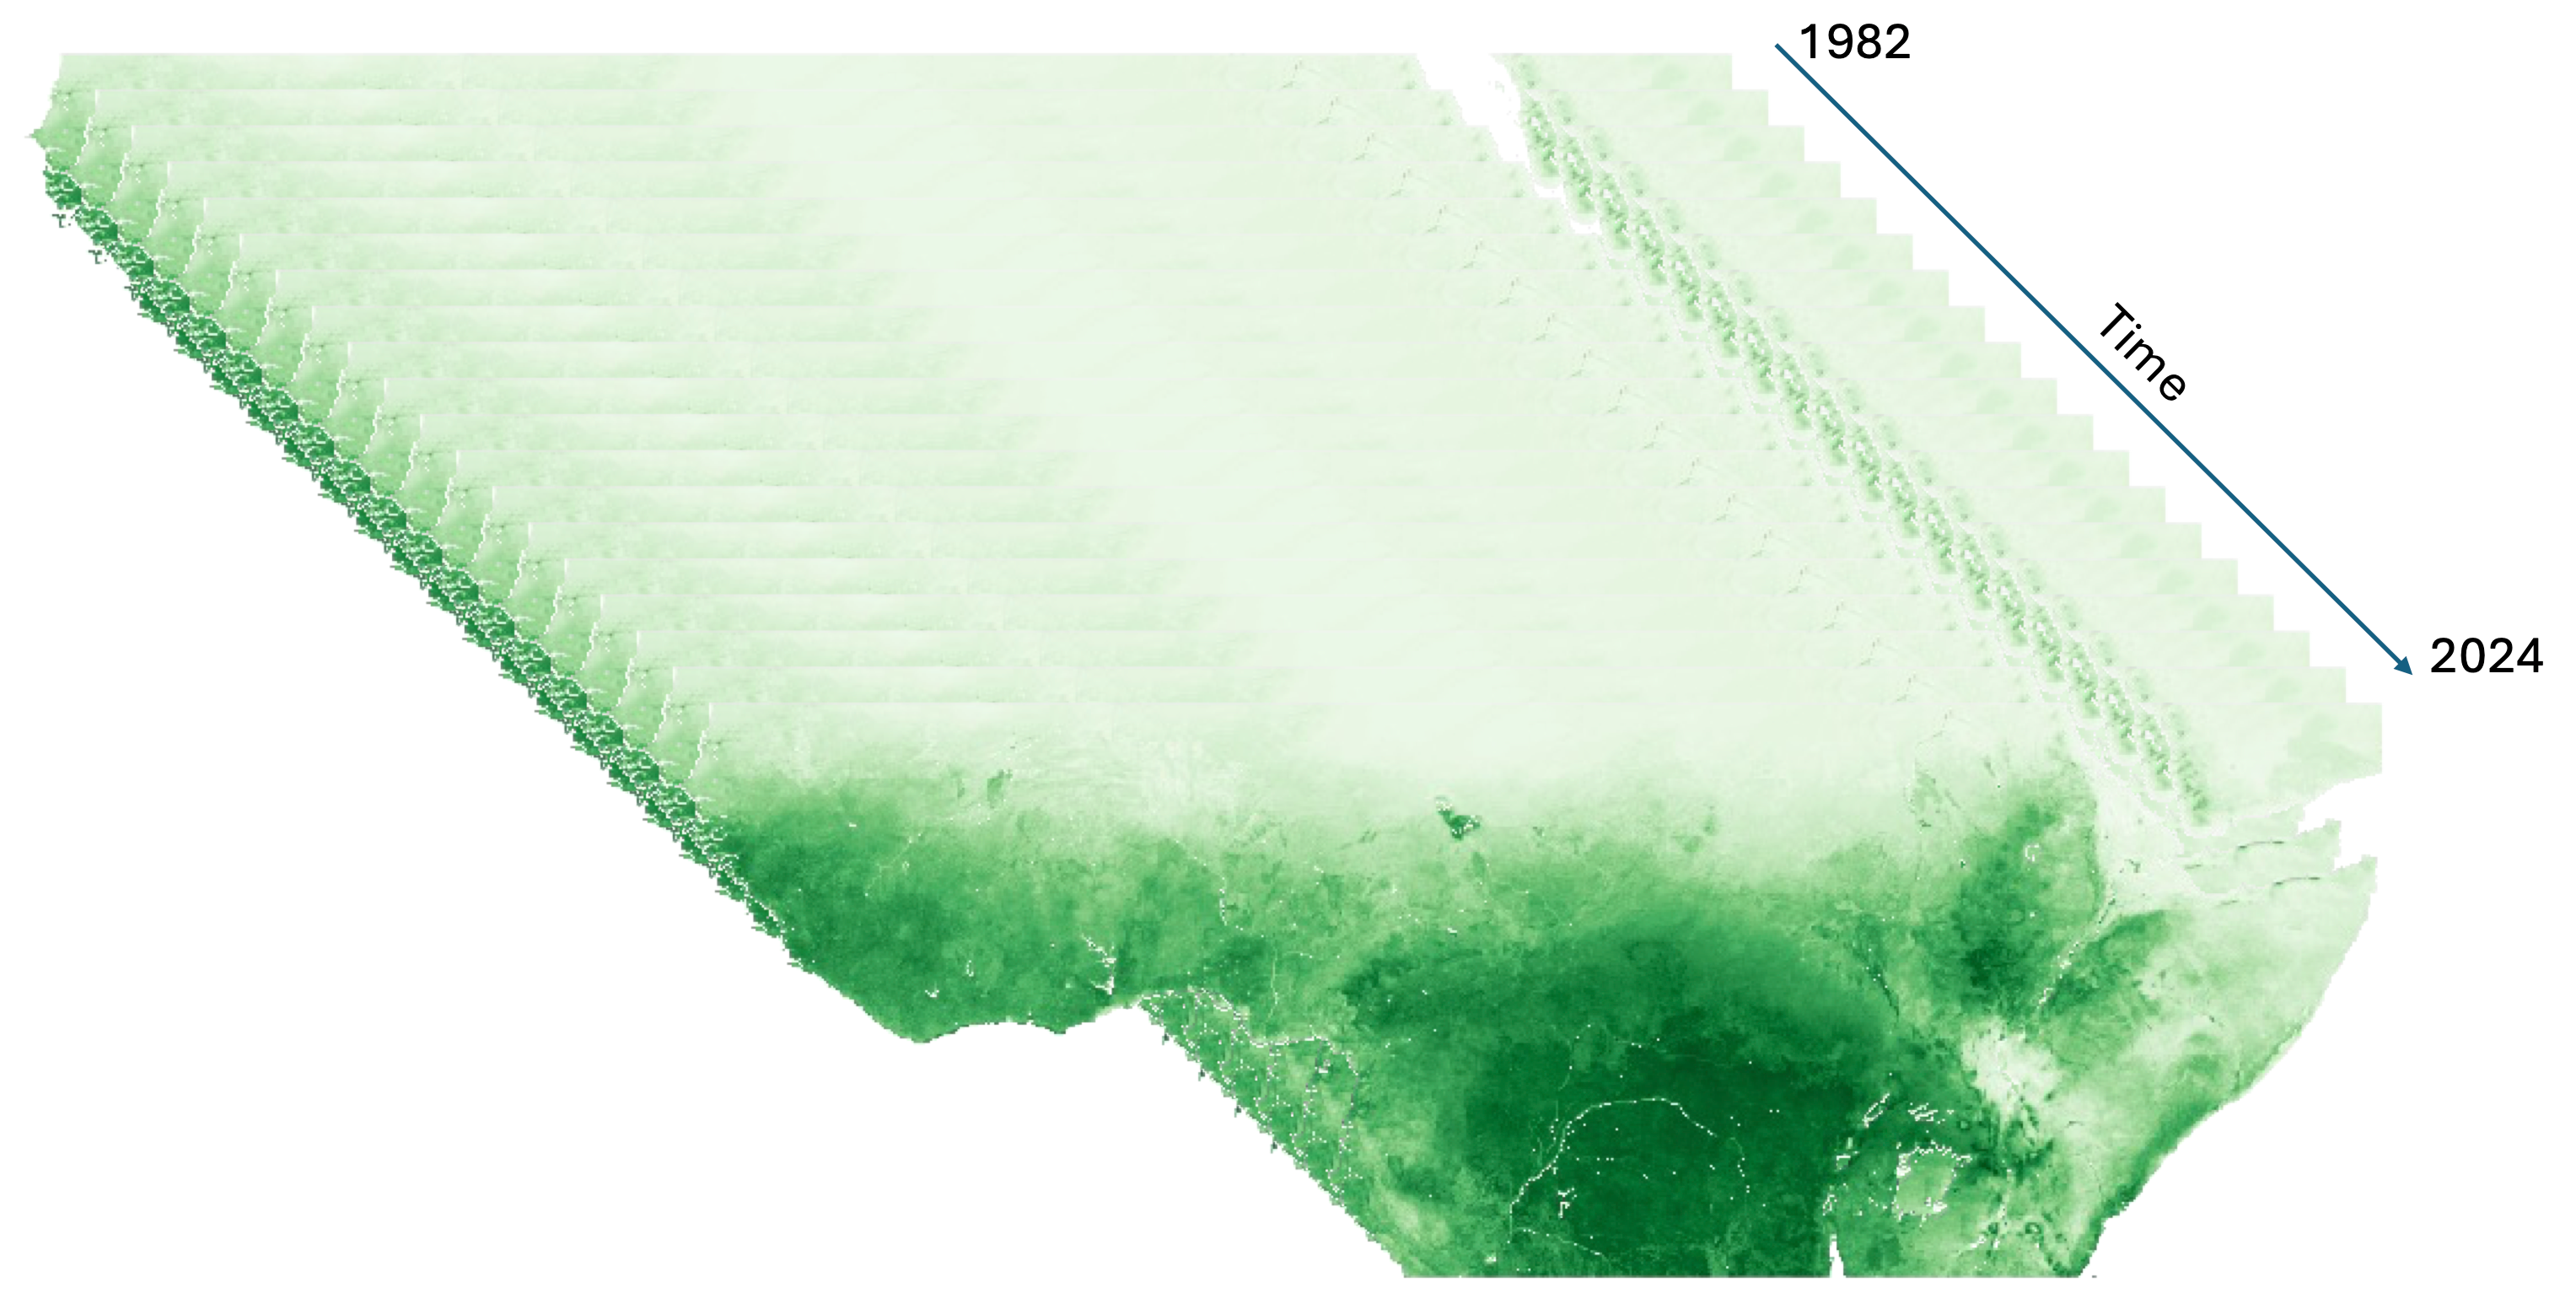
Data from 1982 to 2024
We used NDVI data spanning from 1982 to 2024. Since no single satellite mission provides continuous NDVI data for this entire period, we integrated data from two missions:
-AVHRR (Advanced Very High-Resolution Radiometer): 1982-2023
-MODIS (Moderate Resolution Imaging Spectroradiometer): 2000-present
By merging AVHRR and MODIS NDVI datasets, we created a continuous time series that allowed to monitor vegetation changes over the past four decades at 8 km resolution. This integration ensures that we can track long-term trends in drought while maintaining consistency across different satellite missions.
.
Drought prevalence in the Sahel 1982-2024
This map shows the average number of months per year that an area has experienced extreme drought between 1982-2024.
Over the last four decades droughts have occured most often around the Northern regions of the Sahel. In certain regions in Chad, Sudan and South Sudan, drougths were particularly frequent with extreme droughts occuring 5-8 months per year. Droughts were also frequent in parts of the Western Sahelian countries of Mali, Burkina Faso and Niger where the average number of months with extreme drought was 3-5 months per year.
The number of extreme droughts generally decreased while going South. However, certain parts of Kenya, Ethiopia and Somalia also show high drought prevalence.
.
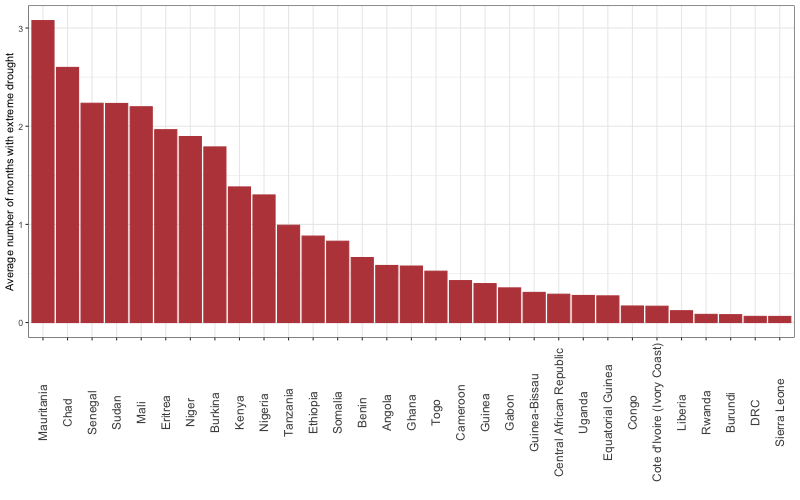
Highest drought prevalence in the northern Sahel countries
On average, most extreme droughts occured in the countries of Mauritania (~3 months/year), Chad (~2.6 months), and Senegal, (South)-Sudan and Mali (all ~2.2 months/year). Drought are much less prevalent in the more vegetated countries, like Siera Leone, DRC, Burundi and Rwanda where extreme droughts were very rare (< ).

.
Drought throughout the years
This animation visualizes the fluctuations of drought occurrence in the Sahel region from 1982 to 2024. The animation is based on Vegetation Condition Index (VCI) data, derived from the NDVI.
Key insights:
Drought Variability – The animation shows how droughts shift in intensity and location over the years, highlighting the dynamic nature of dry spells in the Sahel.
Severe Drought Years – Some periods exhibit widespread drought conditions across the region, particularly during known El Niño years.
.
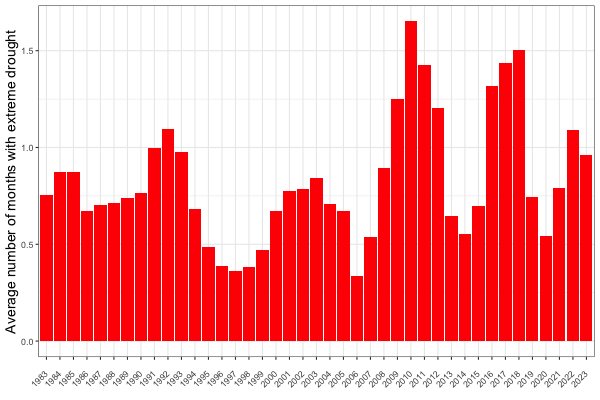
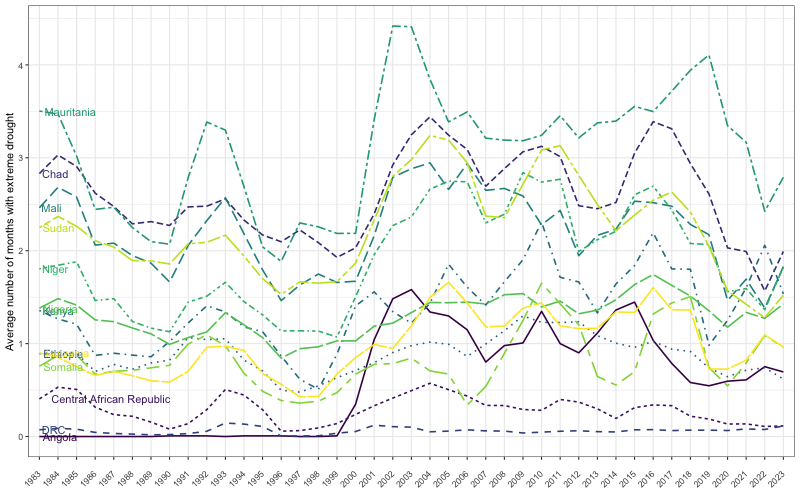
This figure presents the occurrence of extreme drought events for various countries across the Sahel region in the last four decades.
Key insights:
Regional Differences in Drought Frequency
-Countries in West and Central Africa (e.g., Mauritania, Chad, Mali, and Sudan) showed higher drought prevalence, indicating persistent arid conditions.
-In contrast, Angola, DRC, the Central African Republic (CAR), and Ethiopia experienced fewer extreme drought events, reflecting more stable moisture conditions or different climatic influences.
Periodic Spikes in Drought Across All Countries
–Certain periods, such as 1992 and 2003, showed consistent increases in drought intensity across countries, suggesting widespread climate anomalies affecting multiple ecosystems simultaneously.
-However, the severity of the droughts was not always synchronized across regions.
Regional Variability in Drought Trends
-The 2011–2012 drought was particularly severe in East African countries (e.g. Somalia, Kenya, Ethiopia), contributing to a major humanitarian crisis. However, this spike was not observed in West Africa, indicating the significance of localized drivers.
Long-Term Increase in Extreme Drought Events
-Over the last four decades, there has been a rising trend in the frequency and intensity of extreme droughts across the region.
![]()
.
Trends in Extreme Droughts across the Sahel
This map shows the linear trend in drought events in the Sahel region. A coefficient of +0.1 indicates an average increase of 10% in droughts per year over the last 42 years.
Key insights:
Stable Drought Conditions in the Less Arid, More Vegetated Areas
-In the less arid and more vegetated parts of the region, drought trends remained relatively stable over time.
-These areas experience, historically, few dry spells conditions. The high vegetation cover provides a buffer against extreme droughts.
Strong Fluctuations in the Northern Sahel
–The northern parts of the Sahel exhibited high variability in drought trends, with some areas experiencing high increases and others displayed strong reductions in droughts.
Hotspots of Increasing Drought in Kenya, Sudan, Niger, and Mauritania
-Specific hotspots in Kenya, Sudan, Niger, and Mauritania show strong increases in drought frequency over the last 42 years.
-These arid regions are particularly vulnerable due to their reliance on rain-fed agriculture and pastoralism, making them more sensitive to prolonged dry spells.
Note: Potential Influence of Land Degradation on Drought Trends
-Since this drought assessment was based on the current vegetation cover in relation to historic conditions, some of these trends could be influenced by land degradation, deforestation, and agricultural expansion rather than just climatic changes. -Areas with increased land clearing or declining tree cover may show an artificial increase in drought frequency due to reduced vegetation resilience rather than purely climatic factors.

Example: Somalia Drought 2011-2012
The 2011–2012 drought in Somalia was one of the most severe in recent history, leading to a humanitarian crisis. The drought began in late 2010, intensified throughout 2011, and had lasting effects into 2012, particularly in the southern and central parts of the country. The drought was triggered by two consecutive failed rainy seasons, including the 2010 Deyr (October–December) rains and the 2011 Gu (April–June) rains. This resulted in severe water shortages, crop failures, and a drastic decline in livestock numbers, which forced people to flee to neighborhing countries.
Prolonged drought in Somalia 2008-2013
The information from the satellites shows there was already increased droughts in Somalia in 2008 which lasted until 2013. This shows that the huminitarian crisis in Somalia was not only the effect of failed rains in 2010 and 2011 but that these events happened in an already stressed environment. On the map animation, we can see the location of the droughts and how they spread through Somalia. Around May 2011 the drought reached its peak as large parts of the country were experiencing extreme drought.