Spatial Data for Restoration Decision-Making - Ethiopia Workshop
Connecting field data, land health monitoring and practical spatial analysis for more informed restoration decisions across the eastern Great Green Wall
Spatial Data for Restoration Decision-Making
From field observations to spatial analysis and decision-support dashboards - Ethiopia, 2026
Key takeaways
- Participants from four Eastern Great Green Wall countries explored shared approaches to using spatial evidence for restoration.
- The workshop connected field data, land health indicators, climate information and spatial analysis through practical exercises.
- Participants explored the Regreening App and Data Reporting System as tools for documenting and managing georeferenced restoration activities.
- Hands-on R exercises introduced a reusable workflow for loading, examining, cleaning, analysing, visualising and interpreting environmental data.
- New GGW dashboard features were introduced, including a point sampling tool and tools for creating customised data visualisations.
- Group exercises and discussion focused on how K4GGWA tools can support national and regional restoration planning, monitoring and reporting.
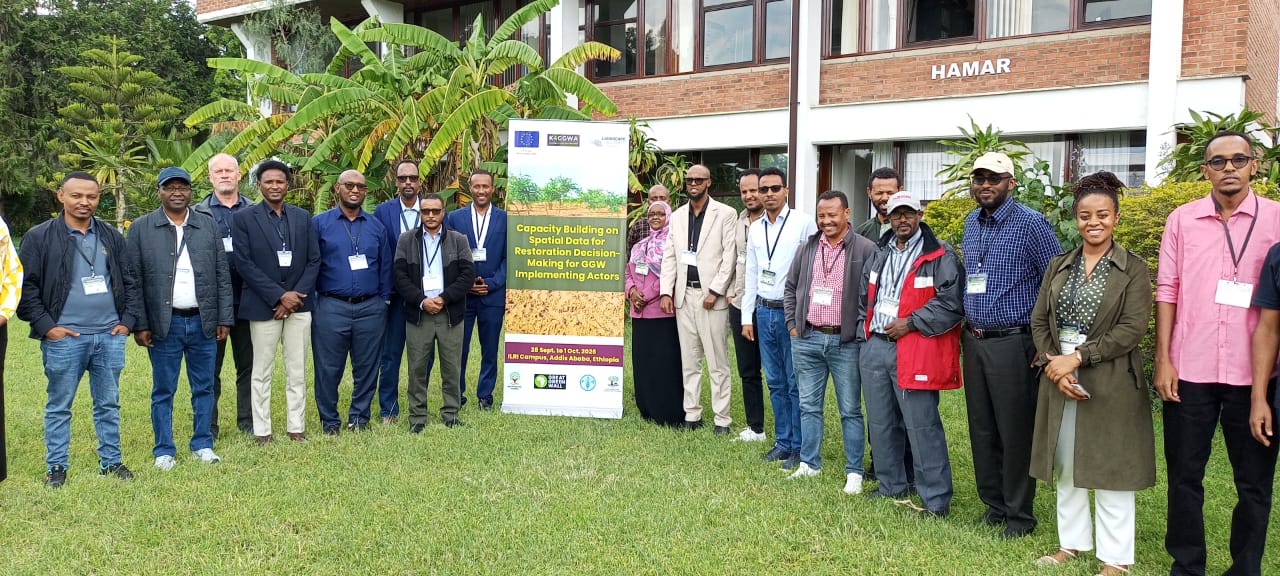
Workshop overview
The Ethiopia workshop was the final edition of the three-part K4GGWA capacity-building workshop series, bringing together 23 participants from Djibouti, Ethiopia, Somalia and Sudan to explore how spatial data can support restoration decision-making across the eastern Great Green Wall.
The four-day program covered understanding how restoration data are generated, hands-on data analysis, and applied decision-making and personal data visualisation projects.
Day 1 introduced the main data collection and management tools used throughout the workshop, including the Regreening App, Data Reporting System (DRS) and Land Degradation Surveillance Framework (LDSF). Days 2 and 3 were dedicated to practical analysis in R: first working with climate datasets, then applying the same analytical skills to land and soil health datasets. The final day brought these skills together through applied decision-making activities using the GGW dashboards, systems-level reflection on participants’ own work, and a final exercise in creating a visualisation from participants’ own data.
Designed to connect technical skills with the real decision-making contexts, participants were trained in using tools and data to answer questions on what is actually happening in the landscape, Where ought restoration activities be prioritised, how interventions can be designed and monitored,and where can better data and analysis strengthen existing systems and workflows?
Day 1 - Understanding how restoration evidence is generated
The first day established the foundations for the rest of the workshop, introducing participants to the main concepts, data collection approaches and digital tools used throughout the training.
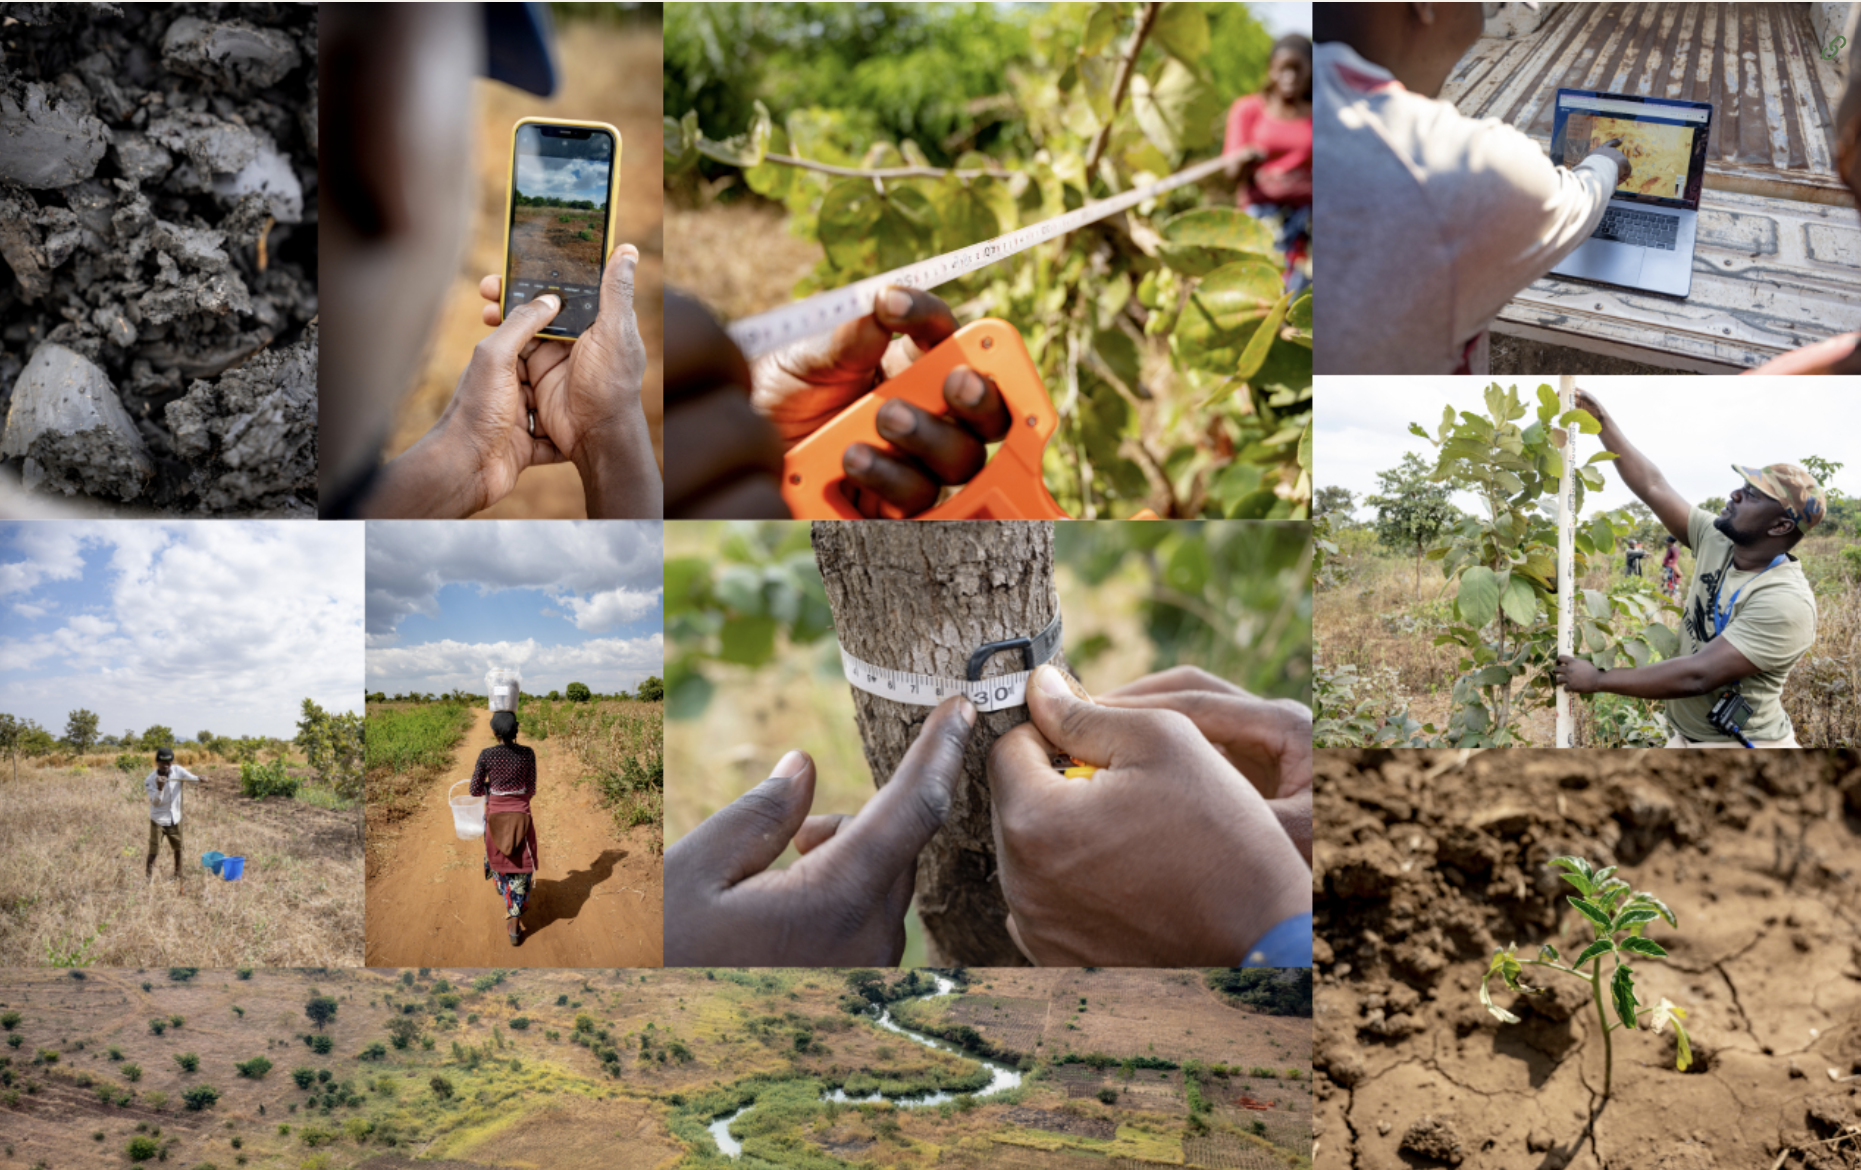
The morning began with an overview of the workshop objectives and outcomes, followed by an introduction to the Regreening App and the Land Degradation Surveillance Framework (LDSF). Practical demonstrations on the ILRI campus showed how LDSF field sampling works and how the Regreening App can be used to document restoration activities and observations in the field.
The afternoon session covered a deeper exploration of the Regreening App and Data Reporting System (DRS). Participants explored how field data can be synchronised to the DRS and how collected information can subsequently be accessed and managed through the platform.
The day established an important foundation for the rest of the workshop on where data actually comes from, how it’s collected and managed, and how it can be analysed and used as evidence in decision-making.

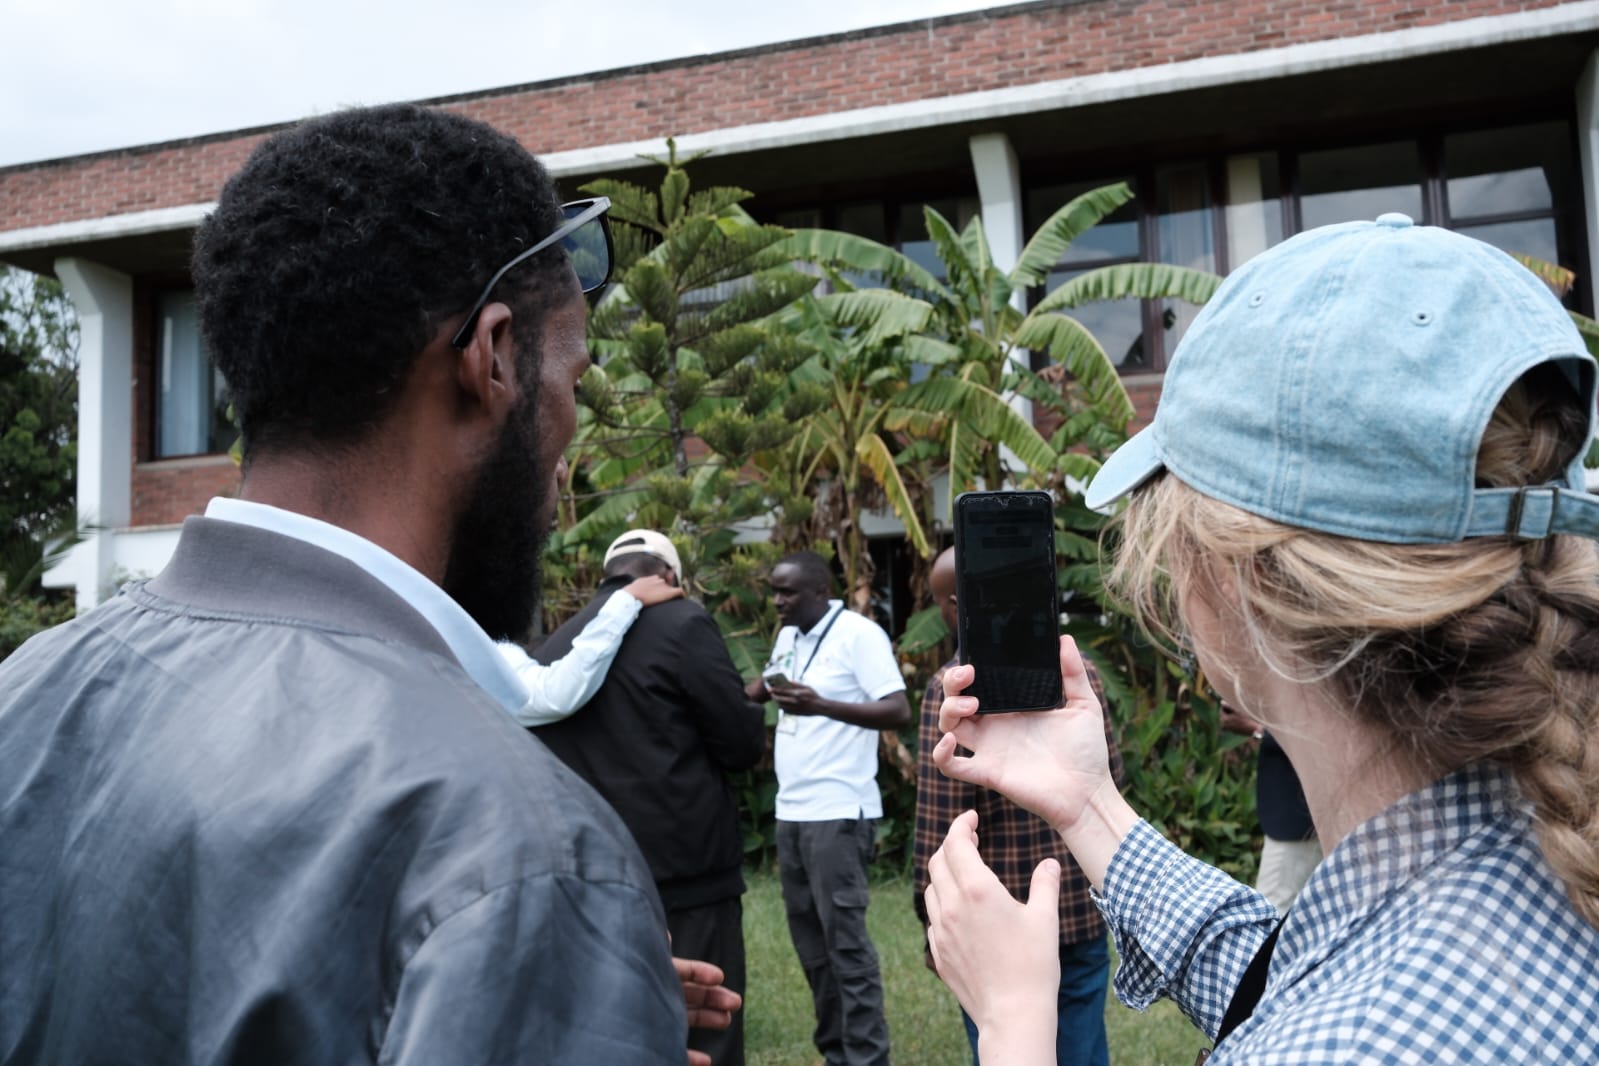
Day 1 demonstrations and practical sessions on the Regreening App, DRS and LDSF
Day 2 - Hands-on data analysis: working with climate datasets
Day 2 moved from concepts and demonstrations to hands-on data analysis, with a focus was on building practical skills for loading, handling, exploring and visualising climate datasets in R.
Participants were introduced to the analytical environments used during the workshop - R, RStudio and R notebooks - alongside the GGW dashboards and other spatial data resources. The session introduced basic concepts of data access, data structure and reproducible analysis before moving into guided exercises.
Working through the first R notebook, participants practised a core workflow for working with environmental data:
Load > Examine > Clean > Analyse > Visualise > Interpret
The exercises focused on climate datasets (rainfall and temperature) and introduced participants to common approaches for summarising and exploring variables. Using packages such as dplyr and ggplot2, participants produced different types of graphs and summaries and began to explore how visualisation can reveal trends, variation and unusual observations in this data.
The afternoon continued with hands-on notebook exercises, giving participants time to work through the analysis themselves and build familiarity with the R workflow.
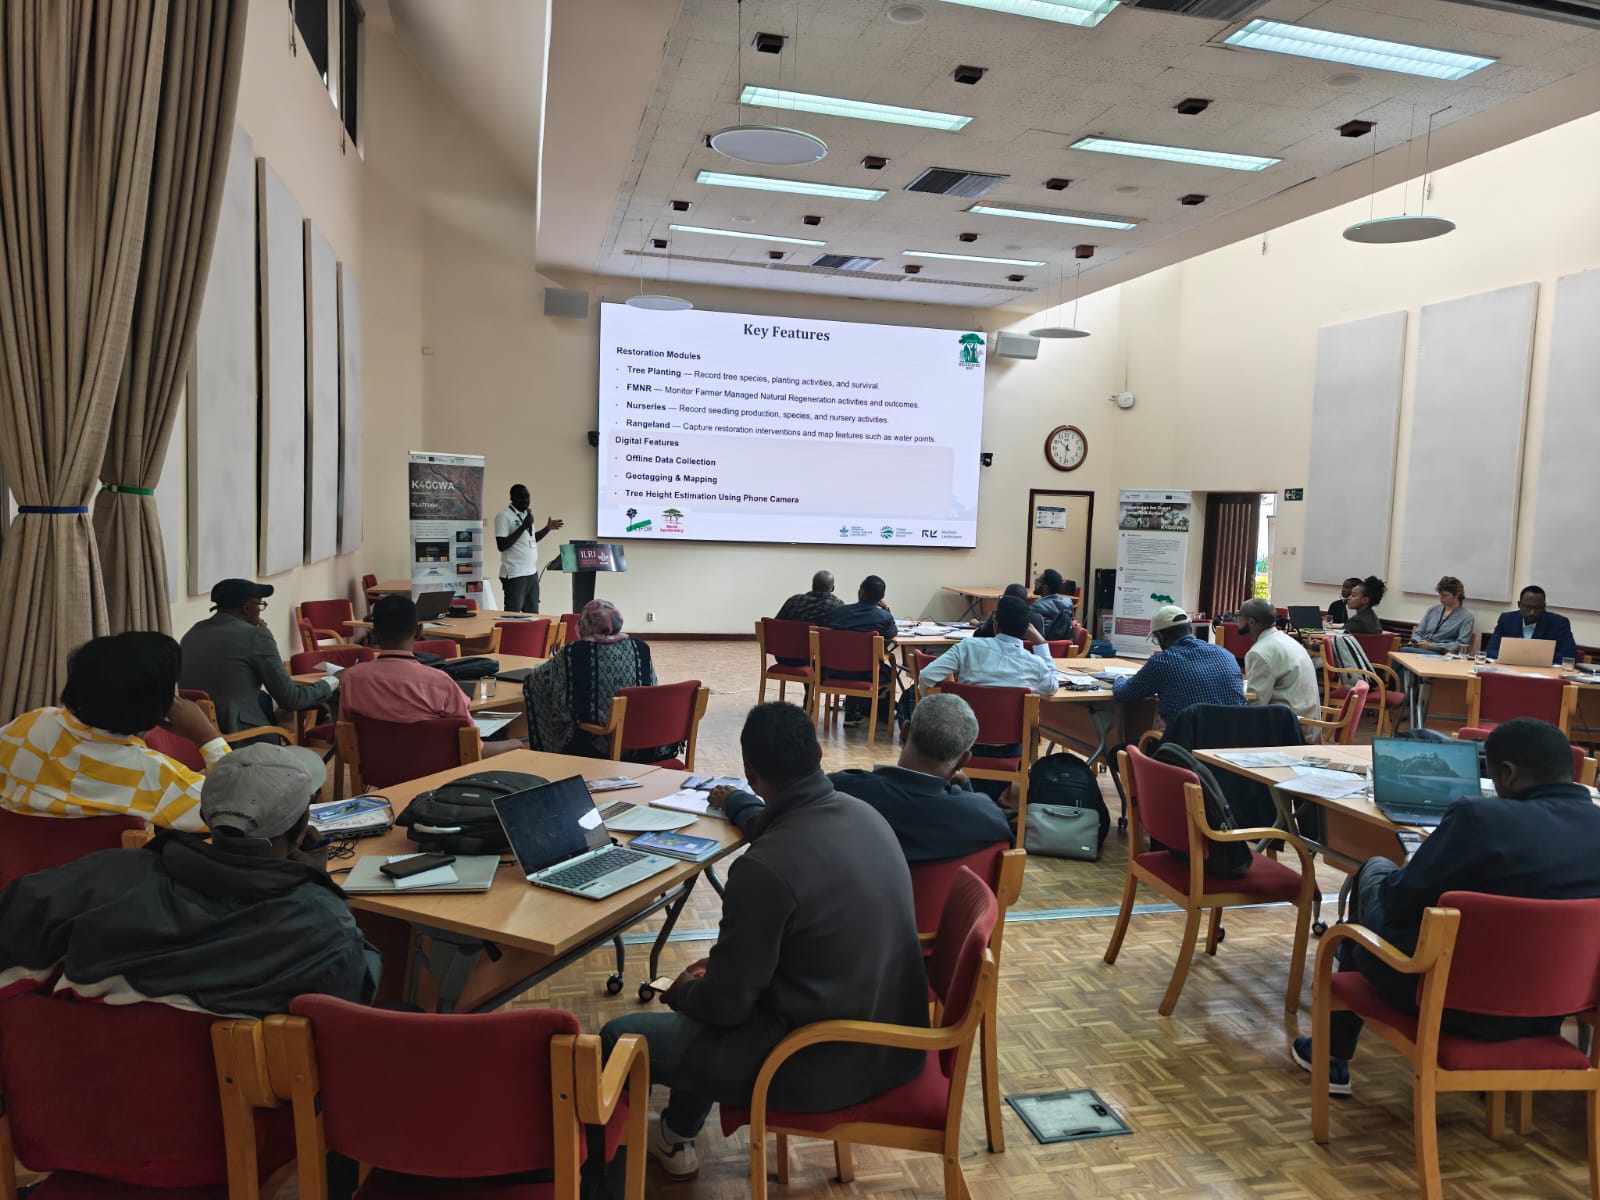
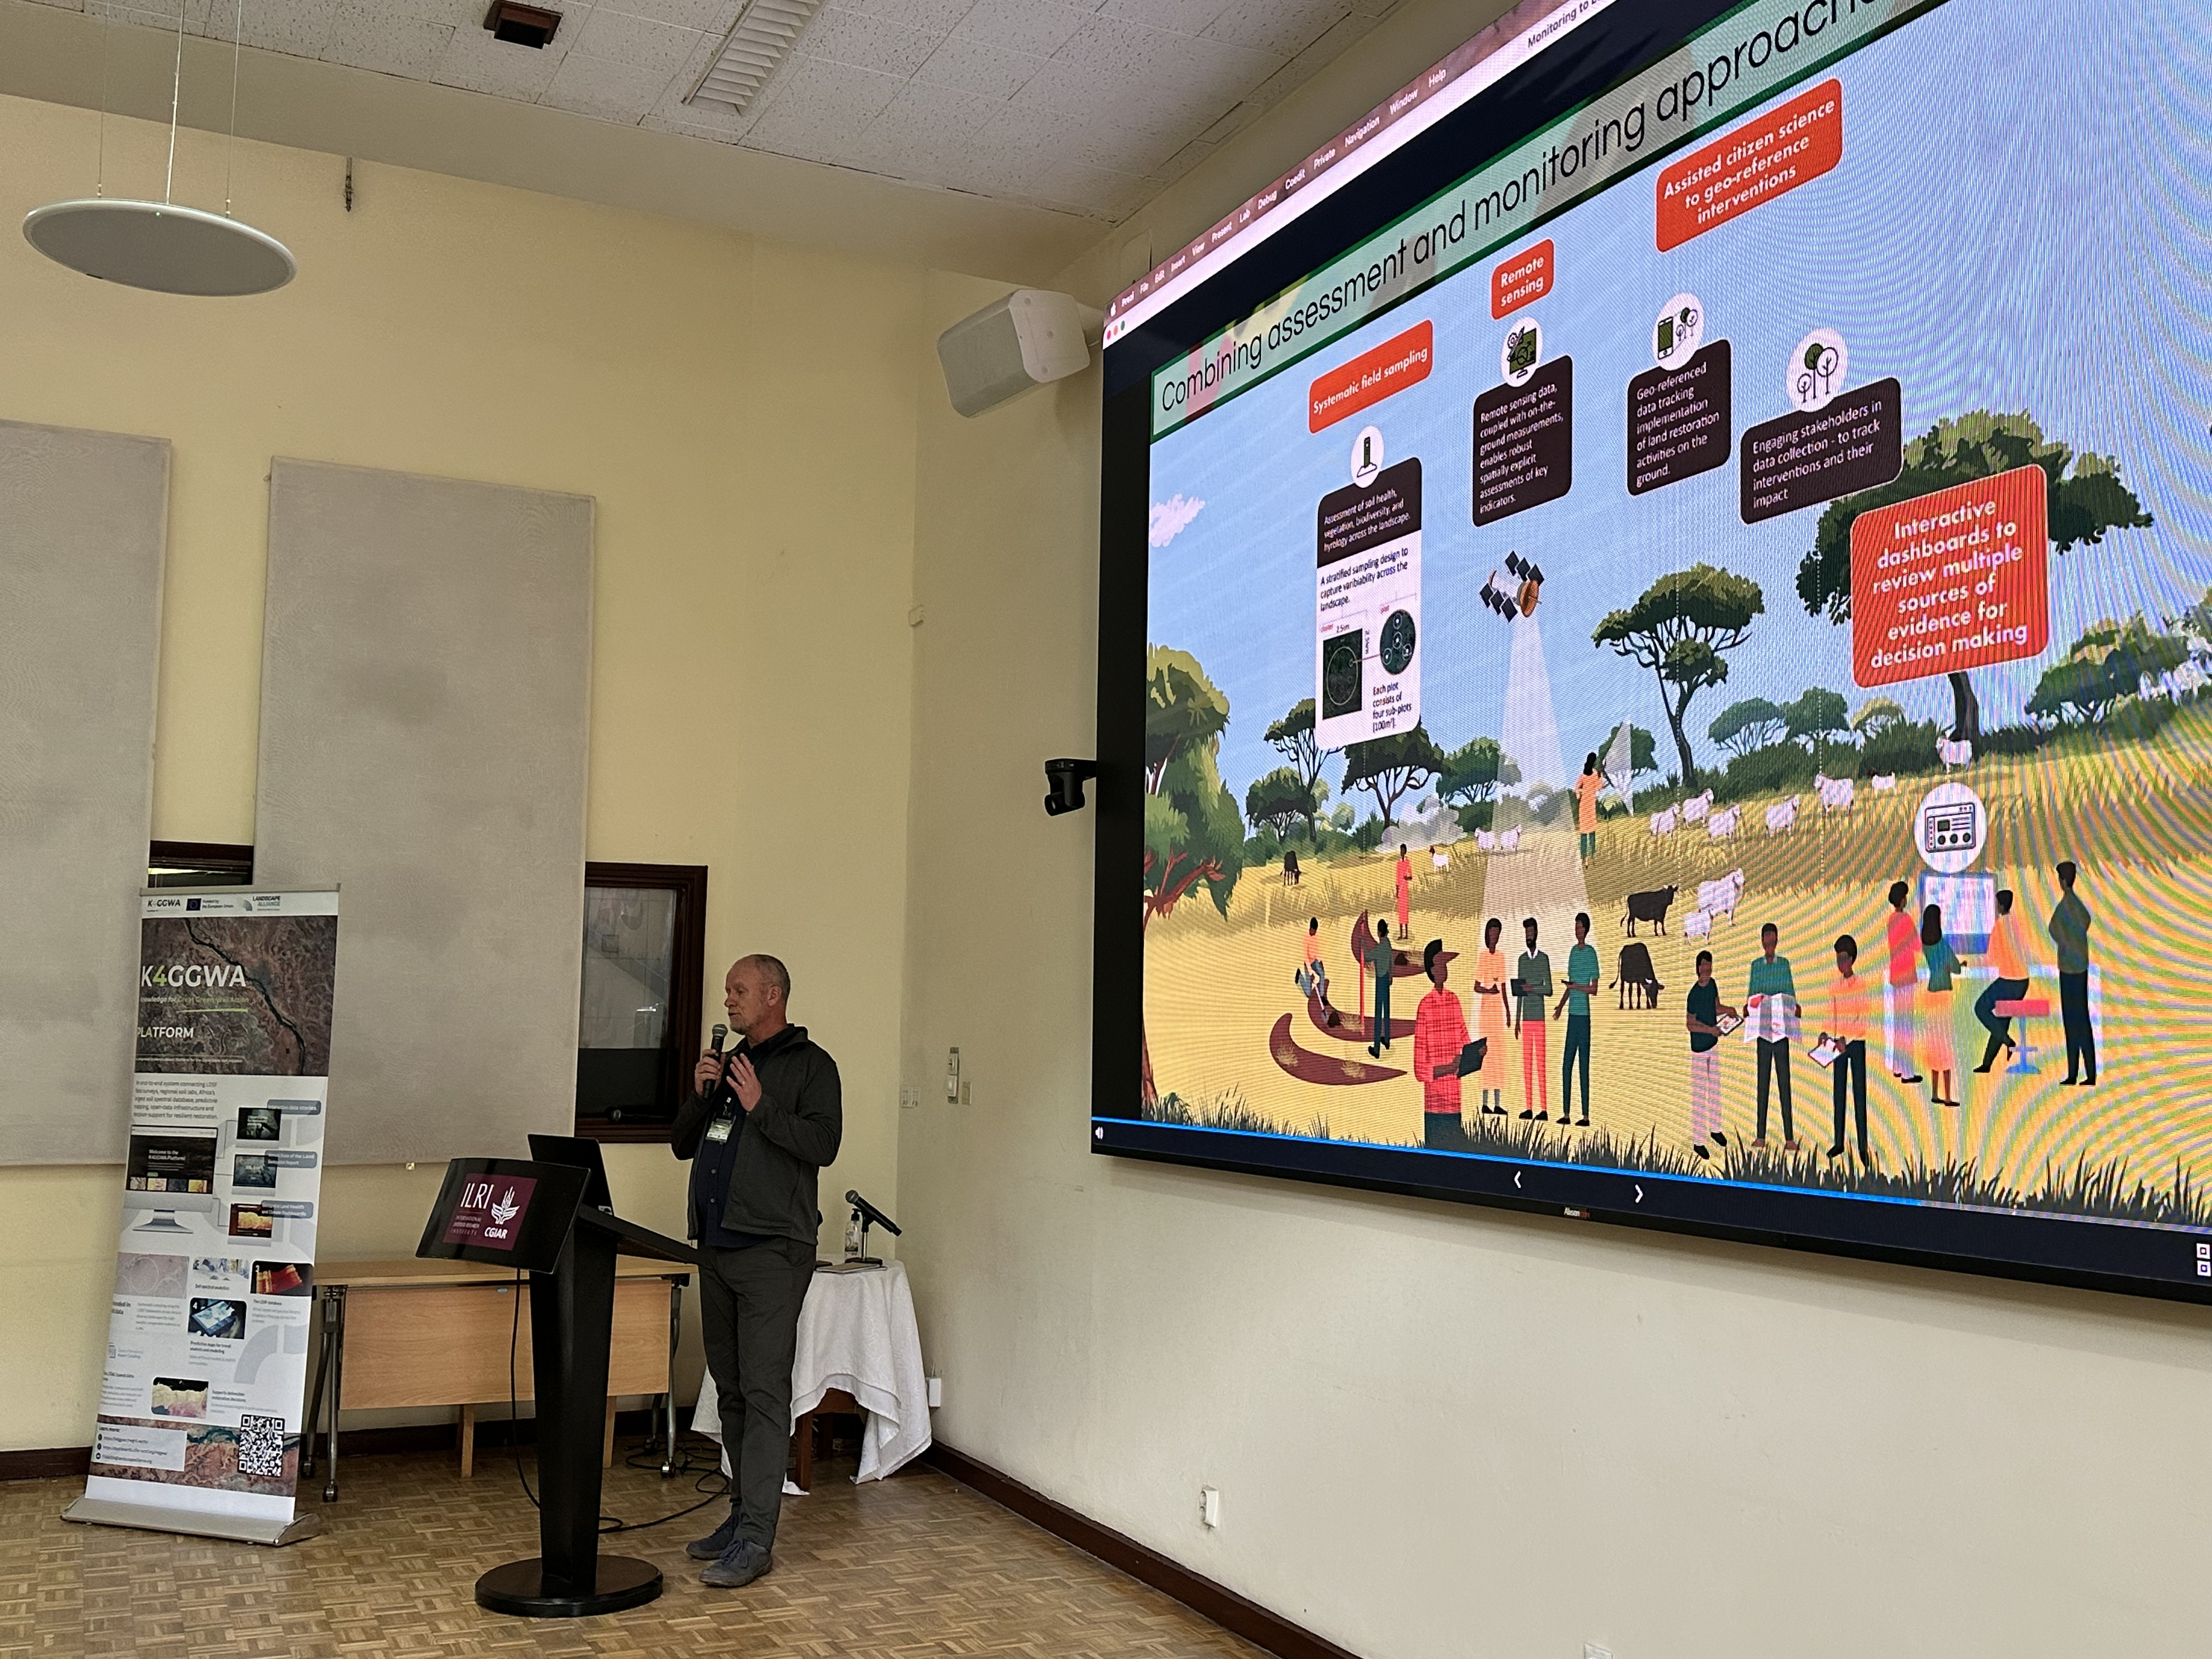
Participants working through hands-on climate data analysis exercises in R
Day 3 - Hands-on data analysis: land and soil health
Day 3 continued the practical data analysis work, building directly on the skills developed with climate datasets on Day 2. This time, participants worked with land and soil health datasets, using R to explore trends, spatial patterns and indicators of environmental condition.
The second R notebook introduced additional packages (leaflet and sf) and workflows for working with land health data. Participants were guided through the process of loading and examining the datasets, carrying out exploratory analysis, and producing visualisations that could help communicate patterns in land and soil condition.
The exercises reinforced core data-wrangling and visualisation skills while introducing participants to the particular challenges of working with environmental and spatial data. Participants considered what individual indicators represented, how observations varied across locations, and how different ways of visualising the same data can support different questions.
The afternoon continued with hands-on notebook exercises, allowing participants to complete the analysis and experiment with the different visualisation approaches introduced during the day.
The two analysis days were deliberately structured to reinforce each other with Day 2 focused on climate datasets, and Day 3 applying the same analytical principles to land and soil health data. Together, they provided a practical foundation for the applied decision-making activities on Day 4.
Day 4 - Data analysis to applied decision-making
Day 4 brought together the technical skills developed during Days 2 and 3, shifting the focus from how to analyse data to how data can support decisions.
The day was structured around three connected activities: using the GGW dashboards to answer landscape-level questions, reflecting on how data can support participants’ own systems and workflows, and developing a personal data visualisation project.
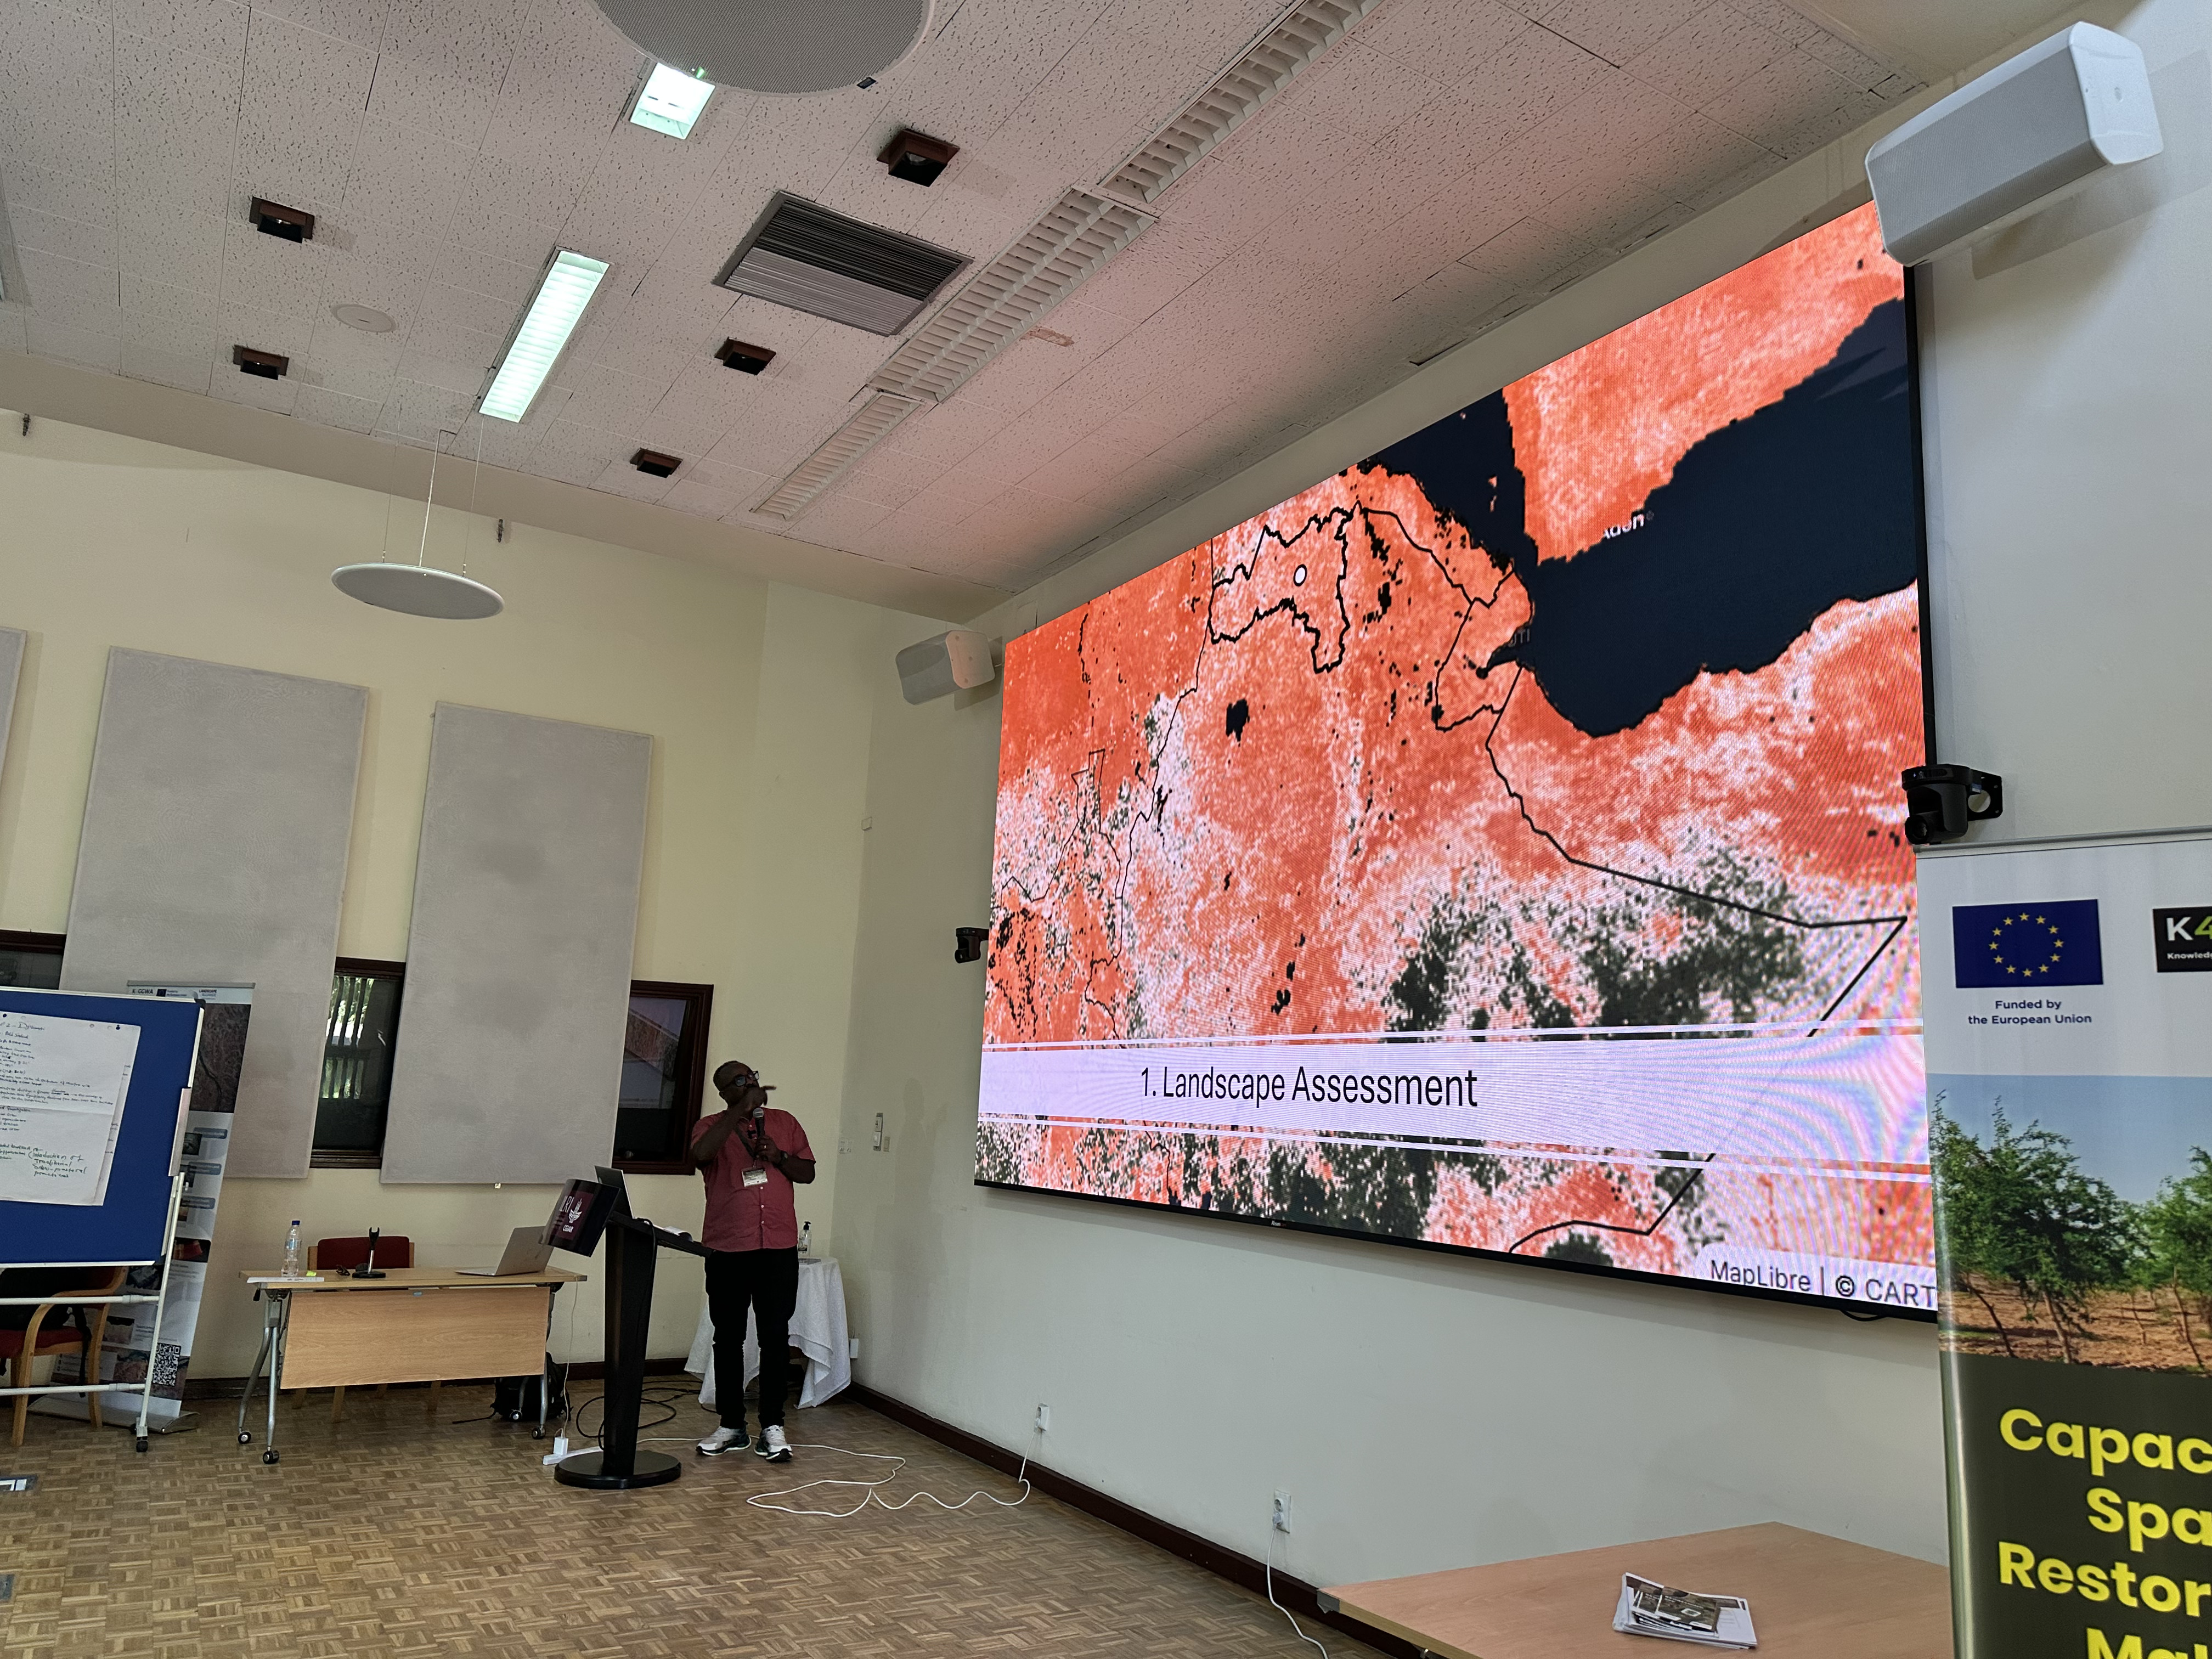
Applied decision-making activities, dashboard exploration and participant data visualisation projects
Using the GGW dashboards to answer questions about the landscape
The first activity focused on using the GGW dashboards as a decision-support tool. Working in groups, participants explored a series of applied questions about a landscape and considered how spatial evidence could support different stages of restoration decision-making including:
- Landscape assessment - understanding the condition and characteristics of a landscape
- Targeting - identifying areas where restoration should be prioritised
- Intervention design - designing interventions that are appropriate for the landscape and its condition
- Monitoring - using spatial indicators to understand change and assess restoration outcomes
Participants explored the dashboards and their different layers and indicators, including the new data sampling functionality, to investigate spatial patterns and extract information relevant to specific locations.
Applied decision-making: understanding the systems context
The second activity moved from the landscape to systems level thinking. Participants reflected on their own institutional and professional contexts and considered how and where data could support the work they are already doing. Instead of starting with a particular dataset or tool, the exercise started with the decision-context and workflow including what decisions are currently being made, what information is needed to support them, and identifying gaps or opportunities.
The systems-level perspective encouraged participants to think about how spatial data and analysis could be integrated into existing processes for planning, monitoring, reporting and coordination rather than treating data analysis as a separate technical activity.
The discussion also provided an opportunity to consider where improved data access, visualisation or analysis could strengthen existing systems and where K4GGWA tools might provide additional value.
Personal project: creating a visualisation from your own data
The final activity synthesised the technical analysis work and the systems work, asking participants to create a visualisation from their own data that could support a decision in their work. Participants were introduced to an additional R notebook which guides them through a personal data visualisation project, using a dataset or data from their own work to create a visual output that could answer a question relevant to their context.
The exercise was assigned as a take-home mini-project, providing an opportunity to participants to apply the skills developed across the previous days (data loading, cleaning, manipulation and visualisation) to a problem that participants actually encounter in their own work, and to use the output in a way that could support a decision or communicate information to colleagues, partners or stakeholders.
The notebook guides participants through deciding what question to ask that might be relevant to their landscapes, which variables to use, which visualisation is appropriate, and how to communicate the result clearly.
From data analysis to decisions
Across the four days, the workshop followed a logic of stepping participants through data generation and management, to analysis, and application.
The first day focused on understanding where restoration evidence comes from and how it is collected and managed. The next two days gave participants practical experience working directly with climate, land and soil health datasets in R. The final day then asked how those analytical skills and spatial datasets can be used in real decision-making contexts.
The new GGW dashboard functionality added another dimension to this process. The point sampling and download tool allow users to move more easily between regional patterns and specific locations, while the ability to create visualisations provides greater flexibility in exploring and communicating environmental evidence, per their own needs and contexts.
A regional conversation for the Great Green Wall
Bringing together participants from Djibouti, Ethiopia, Somalia and Sudan created an opportunity to share experiences across the Horn of Africa and eastern Sahel part of the Great Green Wall.
The countries represented at the workshop have different landscapes, restoration priorities, institutional contexts and data systems. Many of the challenges involved in using spatial evidence for restoration, however, are shared. Accessing relevant datasets, understanding indicators, connecting field observations with spatial information, and translating technical outputs into information that can support planning and reporting, are common challenges and opportunities.
The Ethiopia workshop therefore served both as a training event, knowledge exchange forum and as an opportunity for participants to provide feedback on the tools and approaches being developed through K4GGWA.
This feedback will contribute to the continued development of the K4GGWA platform, GGW dashboards and associated learning resources, helping make spatial evidence increasingly accessible and useful to restoration stakeholders across the Great Green Wall.
Continued access to tools and learning resources
The workshop materials remain available through the K4GGWA platform and Tutorial Hub, allowing participants to revisit the notebooks, repeat the exercises and apply the workflows to their own datasets and questions.
Learn more
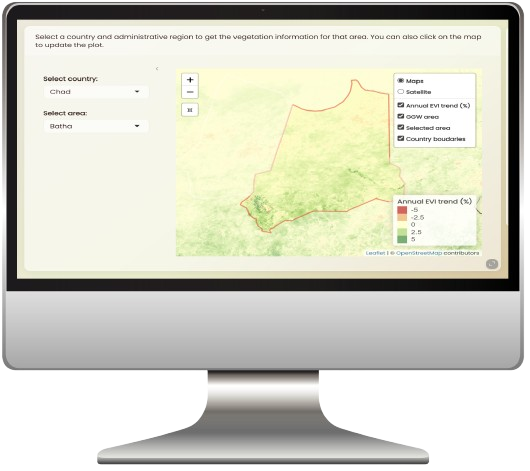
Explore the K4GGWA platform, including the Great Green Wall dashboards and resources for exploring land health, climate and restoration evidence.
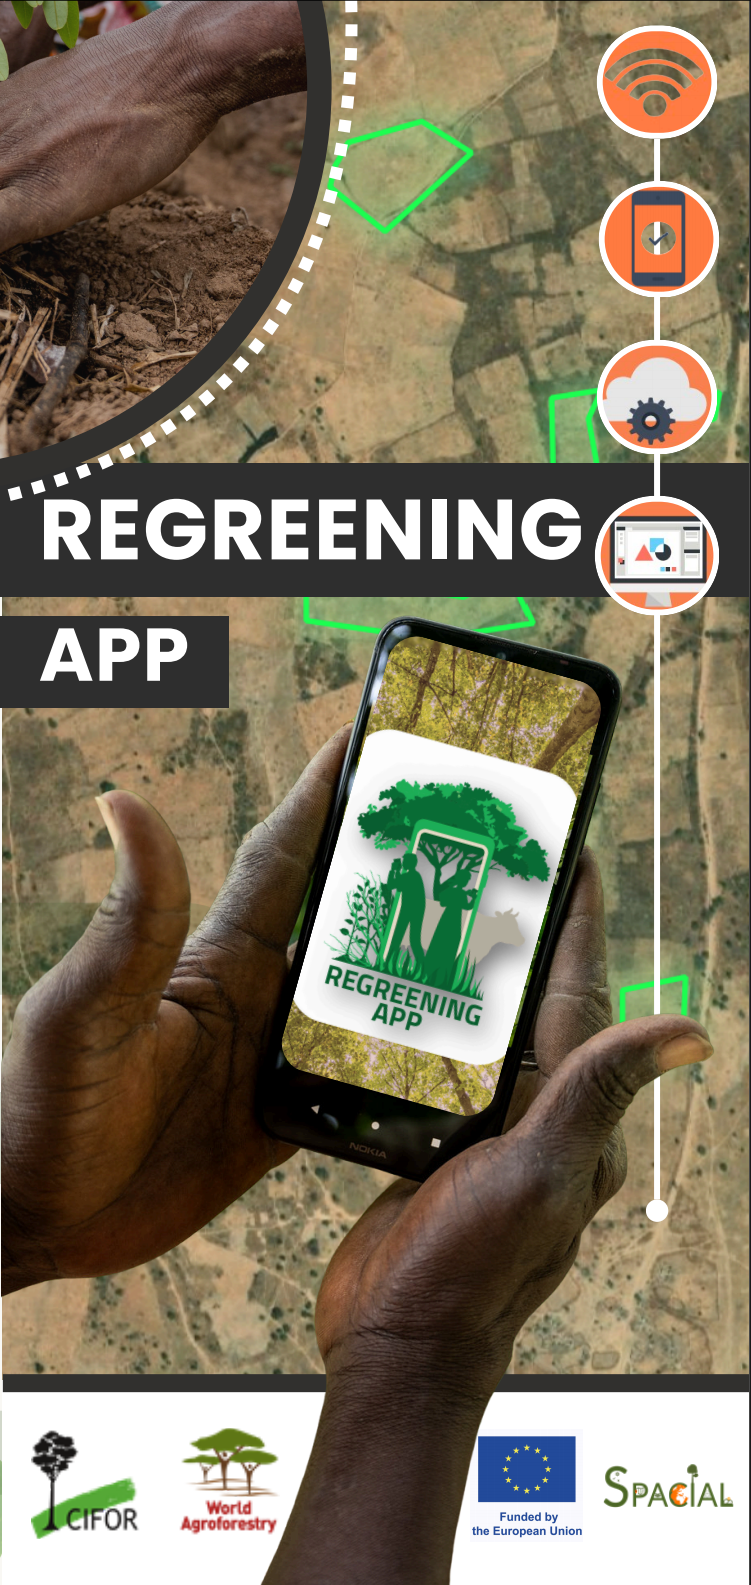
Explore the Regreening App ecosystem for restoration monitoring, georeferenced field data collection and citizen science.
Explore the standardised field methodology and predictive modelling workflows that underpin many land health datasets used across the Great Green Wall region.